mark_dist create a graph of the marking distribution
mark_dist(
  marks,
  mark_col,
  fill_col = mark_col,
  facet_by = NULL,
  scale = NULL,
  na.rm = TRUE
)
Arguments
| marks | data frame of marking info |
|---|---|
| mark_col | column where the mark is found |
| fill_col | column for setting fill |
| facet_by | columns for facet graphs |
| scale | vector of values for the x-axis (full range of the marking scale), defaults to alphabetical or numeric ordering of existing data |
| na.rm | remove NA values in the mark_col |
Value
ggplot
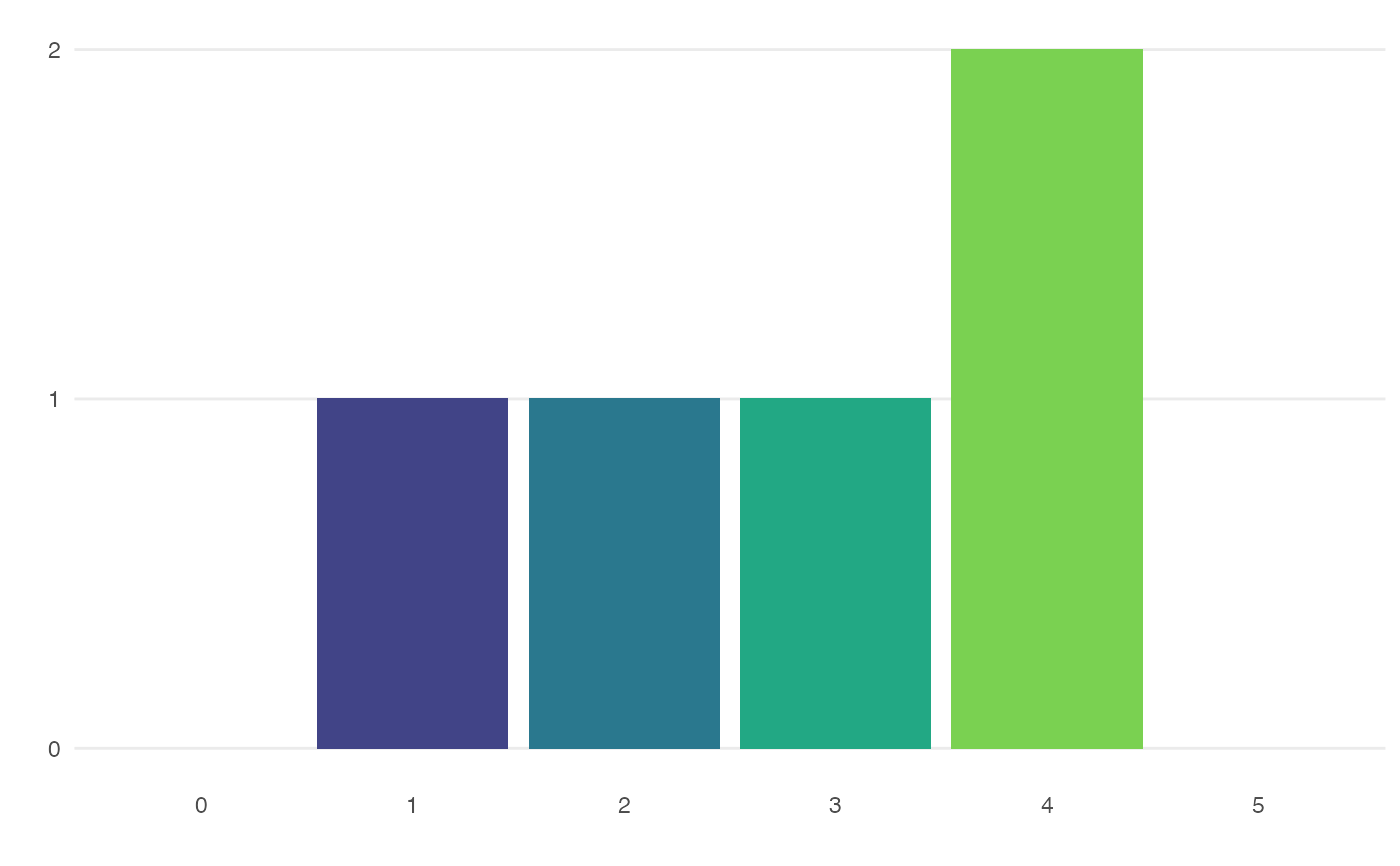
Examples
mark_dist(demo_marks, "mark", scale = 0:5)