Quickstart Demo
Markr has an example marking project that you can use to learn about the package. Run the following code to create a directory called markr_example and open the file demo.Rmd.
markr::markr_example()Open a marking file
You can open the file marks.csv in Excel, but the code below opens it in R and you can click on the object marks in the Environment pane. This data table has a column for the student ID, three columns for category marks (KR, CE and AC), a column for the numeric mark, and a column with individual text feedback.
marks <- read_marks("marks_fb.csv")#> ID name marker question KR CE AC mark feedback
#> 1 S1 Mukul Prof. X A 4 4 4 4 Lorem ipsum...
#> 2 S2 Kias Prof. X B 4 3 2 3 Lorem ipsum...
#> 3 S3 Omair Prof. X B 4 4 4 4 Lorem ipsum...
#> 4 S4 Ramesha Prof. X A 1 2 2 1 Lorem ipsum...
#> 5 S5 Libby-Marie Prof. X A 2 3 3 2 Lorem ipsum...Data Processing
Markr has a convenience function for translating between number and letter grades for different purposes, such as numbers for averaging marks and letters for reporting final grades. It defaults to the glasgow22() scale, but you can add your own scale.
scale <- data.frame(
  numbers = 4:0,
  letters = c("A", "B", "C", "D", "E")
)
marks$grade <- convert_grades(marks$mark, to = "letters", scale)

select(marks, mark, grade)
#>   mark grade
#> 1    4     A
#> 2    3     B
#> 3    4     A
#> 4    1     D
#> 5    2     C
Edit the Template
You will need to create a template R markdown file for individual feedback. You can get a demo template using New File > R Markdown... > From Template.
Each file will have two data objects available to it:
-
marks(the whole marking spreadsheet) -
student(the individual student’s data)
In the most typical case, where each student has one row in the spreadsheet, you can reference the student’s data in code chunks or inline R like this:
---
title: "Feedback"
date: `r format(Sys.time(), '%d %B, %Y')`"
output: html_document
---

**Student**: `r student$name`
**Marker**: `r student$marker`
**Grade**: `r student$grade`
Category Tables
You can display a table of marks for specific criteria by specifying the column names (cols) for each criterion and the order that the categories should go in (cats).
student <- filter(marks, ID == "S2")

category_table(student, cols = c("KR", "CE", "AC"), cats = 1:4)| Criteria | 1 | 2 | 3 | 4 |
|---|---|---|---|---|
| KR | ✔ | |||
| CE | ✔ | |||
| AC | ✔ |
You can translate abbreviations used in the marking sheet using lists and even change the symbol to an emoji.
# set order and translation of criteria columns
# exact column header names = names to display in the table
cols <- list(
  "KR" = "Knowledge and Research",
  "CE" = "Critical Evaluation",
  "AC" = "Academic Communication"
)

# set order and translation of category labels
# category values = labels to display in the table
cats <- list(
  "1" = "Needs Work",
  "2" = "Acceptable",
  "3" = "Good",
  "4" = "Outstanding"
)

# create table for this student
category_table(student, cols, cats, symbol = "✅")| Criteria | Needs Work | Acceptable | Good | Outstanding |
|---|---|---|---|---|
| Knowledge and Research | ✅ | |||
| Critical Evaluation | ✅ | |||
| Academic Communication | ✅ |
Create Feedback
Once you have your marks and feedback in a table and a template file ready, you can create a feedback document for each student with the make_feedback() function.
Make sure to set the filename to something unique for each student. You can use any columns in the marks table as part of the filename.
tempfile <- system.file("basic", "template.Rmd", package = "markr")

x <- make_feedback(
  marks = marks, # or path to tabular data
  template = tempfile,
  filename = "fb/[ID]_[question]"
)
Marking Data
If you have longer blocks of feedback text, the YAML style of marking sheet might work better than spreadsheets. It can be a little tricky to get YAML to parse right, but after you’ve mastered it, it’s an efficient way to store your marking feedback text.
You can include all of the columns or just the student ID and feedback, then join this to the spreadsheet table.
All data in YAML
- ID: S10
  name: Helena
  marker: Lisa
  KR: 4 # use a hash to add comments
  CE: 4
  AC: 3
  mark: A5
  feedback: |
    Here is a paragraph of feedback.

    ## A list of feedback

    * item 1
    * item 2
# all data in one YAML file
marks <- read_marks(yaml = "marks_fb.yml")
Convert table to YAML
If you have tabular data and want to convert it to YAML, use the function tbl2yaml(). You can add extra columns (or overwrite existing columns). Add a filename to save to file.
tbl2yaml(marks, filename = "demo.yml", marker = "Lisa")If you just have a list of IDs and want to create a YAML file for feedback, you can set it up without a pre-existing table. Use "...\n" to insert a place-holder for multi-line info, such as feedback paragraphs
tbl2yaml(ID = marks$ID, feedback = "...\n")
- ID: S1
  feedback: |
    ...
- ID: S2
  feedback: |
    ...
- ID: S3
  feedback: |
    ...
- ID: S4
  feedback: |
    ...
- ID: S5
  feedback: |
    ...
Data in both formats
You can just use YAML for paragraphs of text and put all other data in a table. Set up the YAML file with corresponding ID columns to join rows.
marks <- read_marks(tbl = "marks.csv",
                    yaml = "fb.yml",
                    join_by = "ID")
Summary Plots
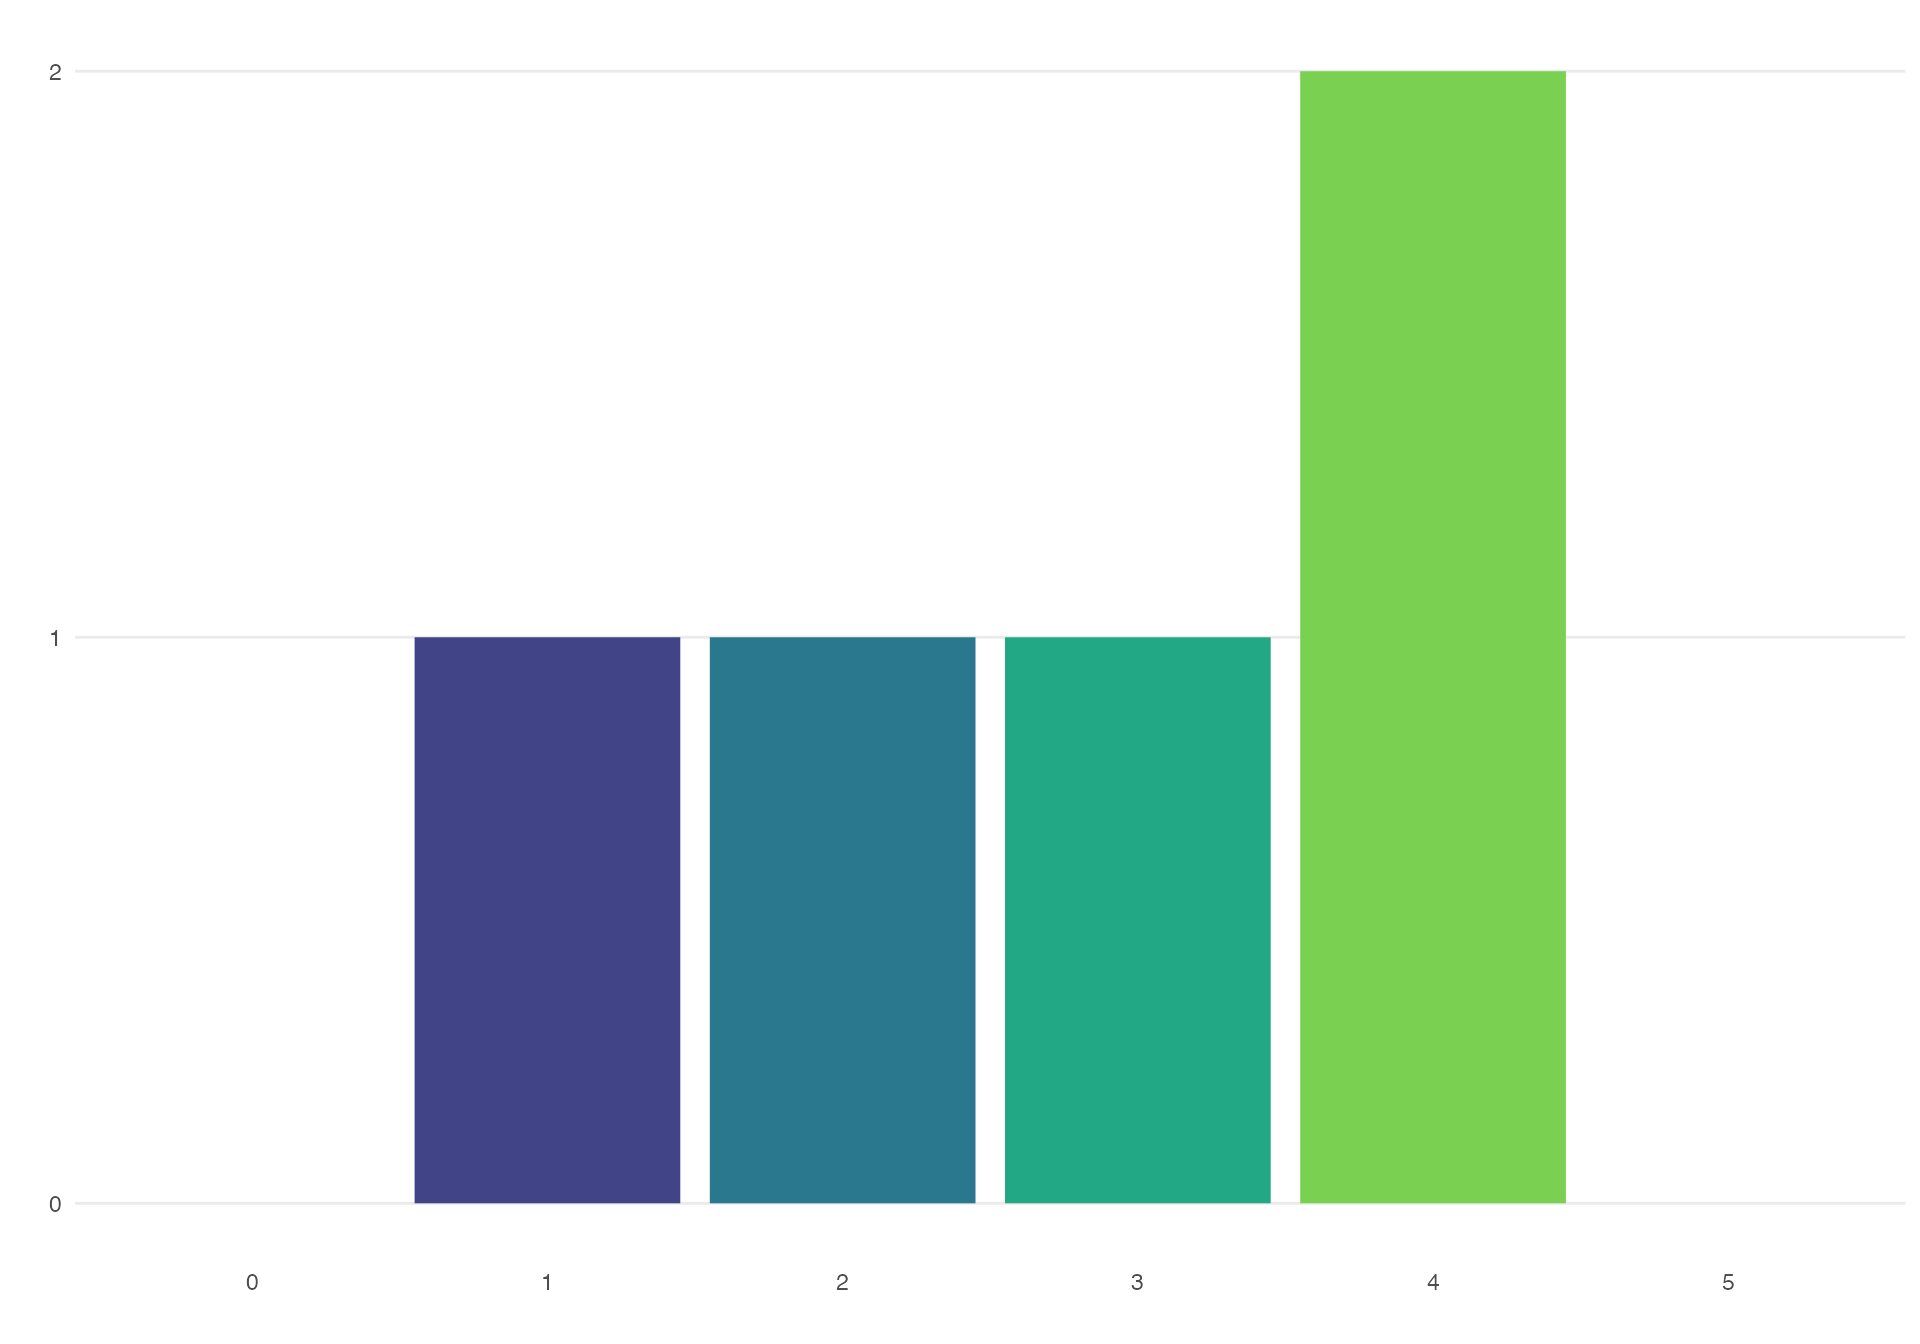
You can display a summary plot of the marks in the student feedback or for your own purposes.
mark_dist(marks, "mark", scale = 0:5)
Faceted plots
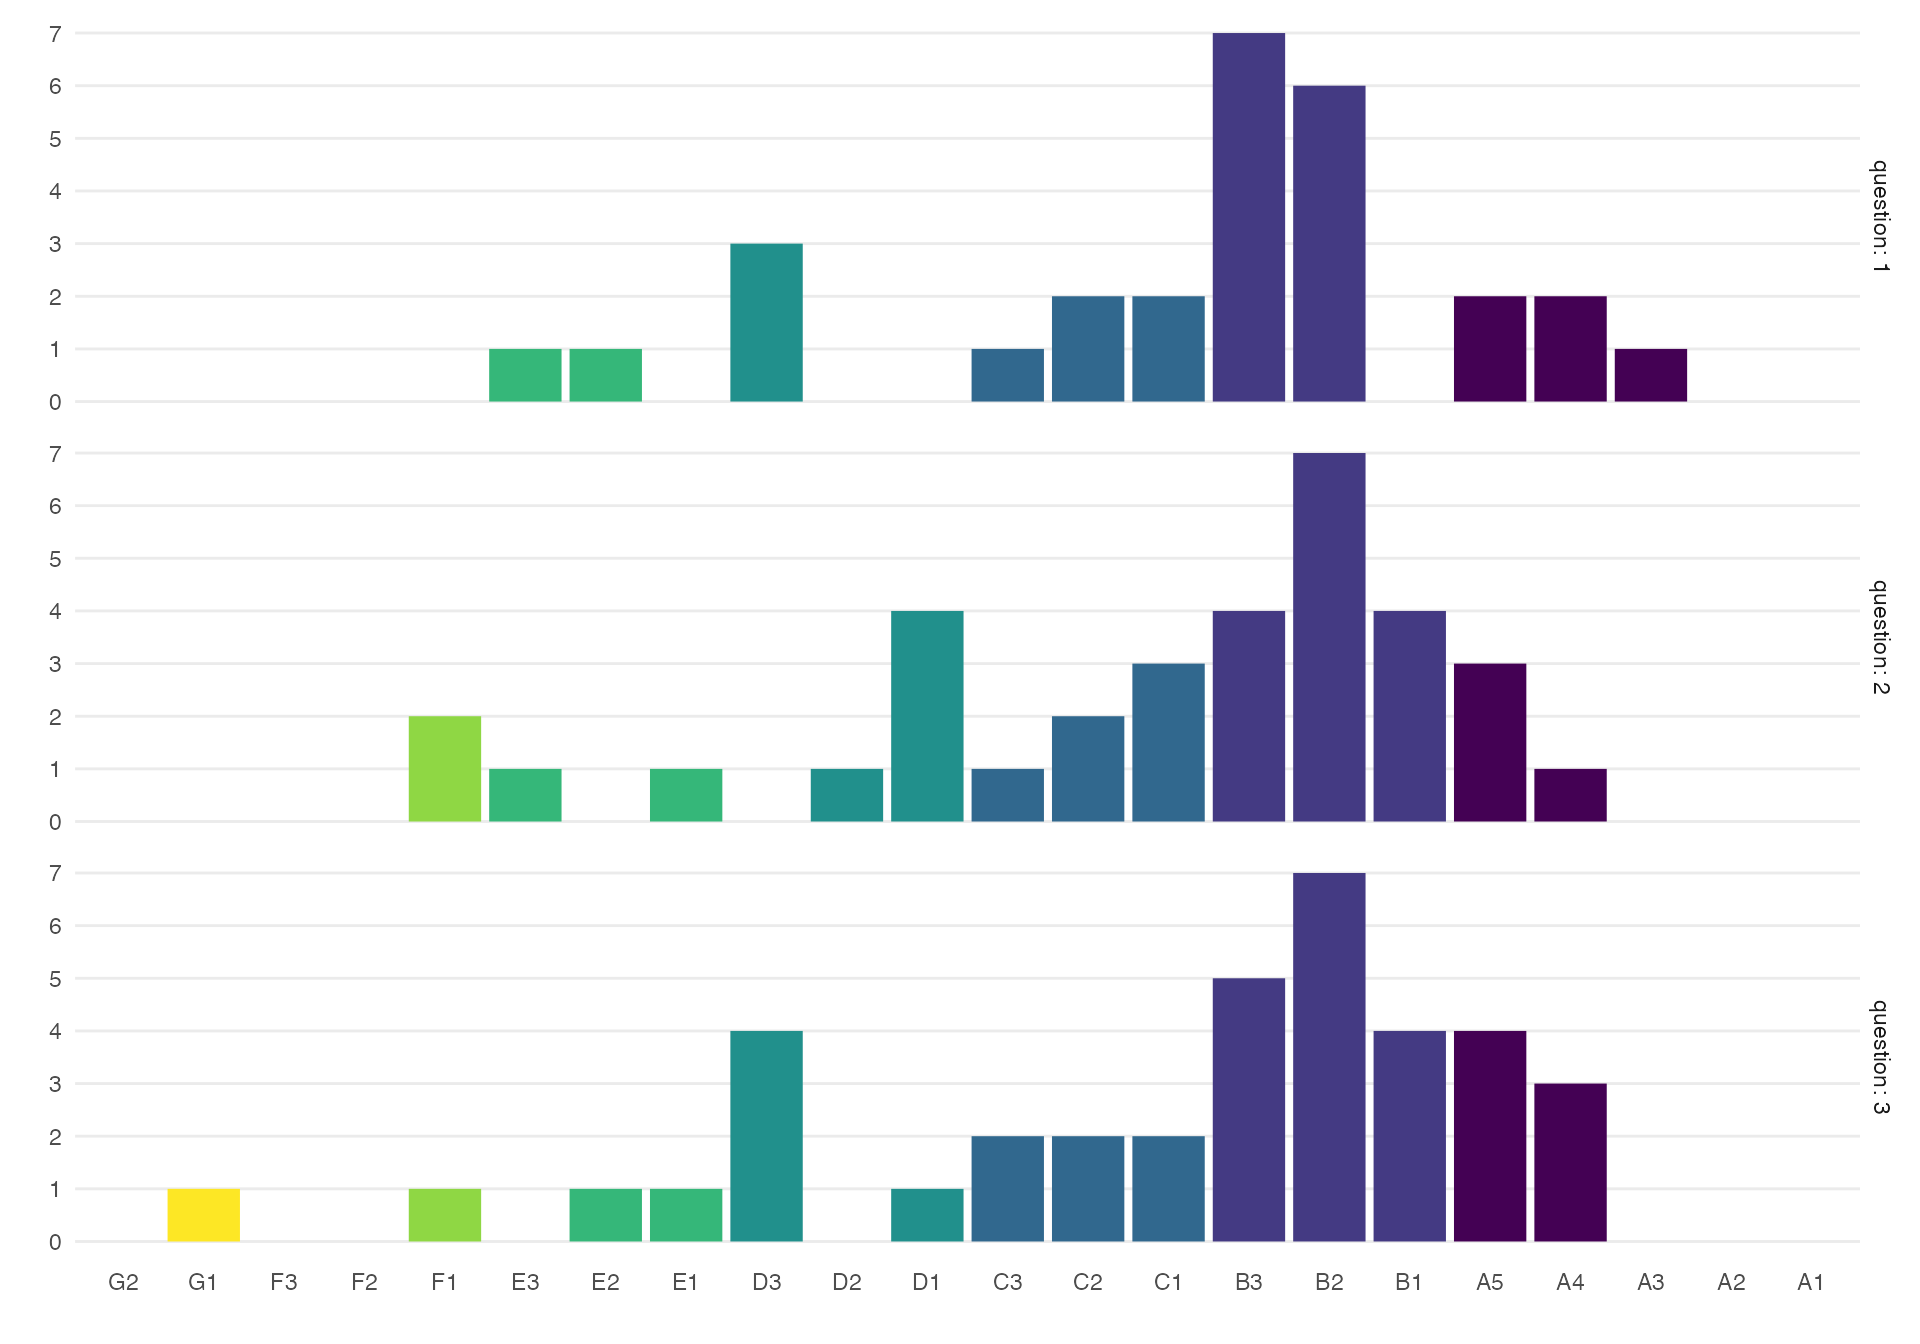
Here we’ve made a new marks table with 100 students. Each student answered one of three questions, indicated by the questions column.
#>   ID question KR CE AC mark letter grade_band
#> 1  1        2  2  4  1   16     B2          B
#> 2  2        1  2  1  1   16     B2          B
#> 3  3        3  2  1  3   18     A5          A
#> 4  4        2  1  4  4   16     B2          B
#> 5  5        1  1  2  3   18     A5          A
#> 6  6        3  1  3  3   13     C2          C
You can plot the letter grade by question using the following code. To get the letters to display in the right order, we set the scale argument to the categories in the order we want to show them. The Glasgow 22-point scale has 4 categories we don’t want to show on this plot, so you can quickly get the values we do want using the code glasgow22()$letters[5:26], or you can manually create a vector with the scale order like c("G2", "G1", "F3", ..., "A1").
mark_dist(marks,
          mark_col = "letter",
          fill_col = "grade_band",
          facet_by = "question",
          scale = glasgow22()$letters[5:26])
Category plots
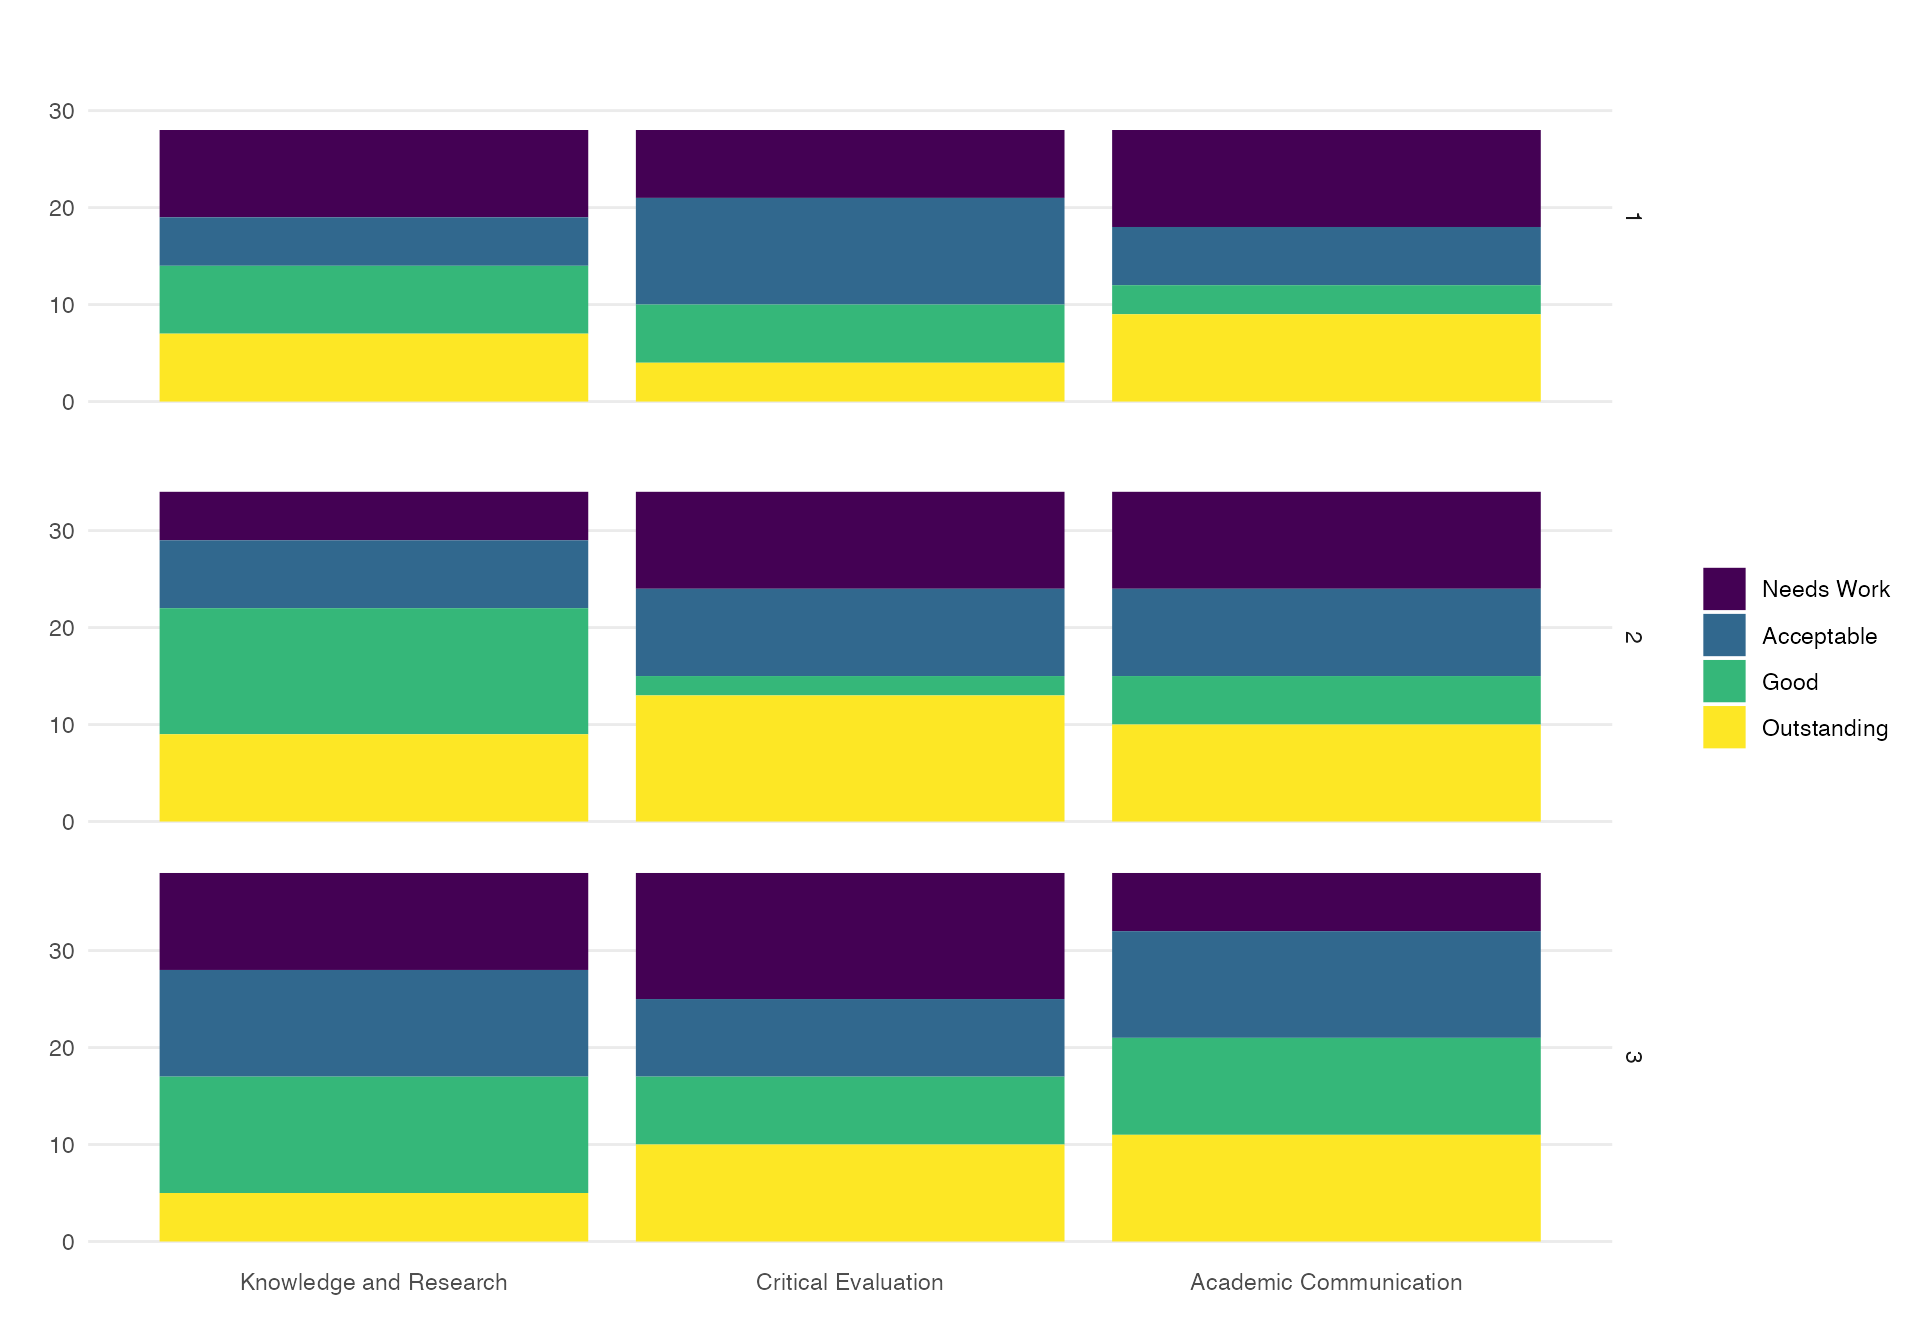
This marking table has three columns that show individual marking criteria: KR, CE and AC, so we could also make a plot of the individual criteria by question. This function uses the cols and cats lists we made above to translate the abbreviations in the marking table to the full terms in the plot.
cat_dist(marks, cols, cats, facet_by = "question")
Category histograms
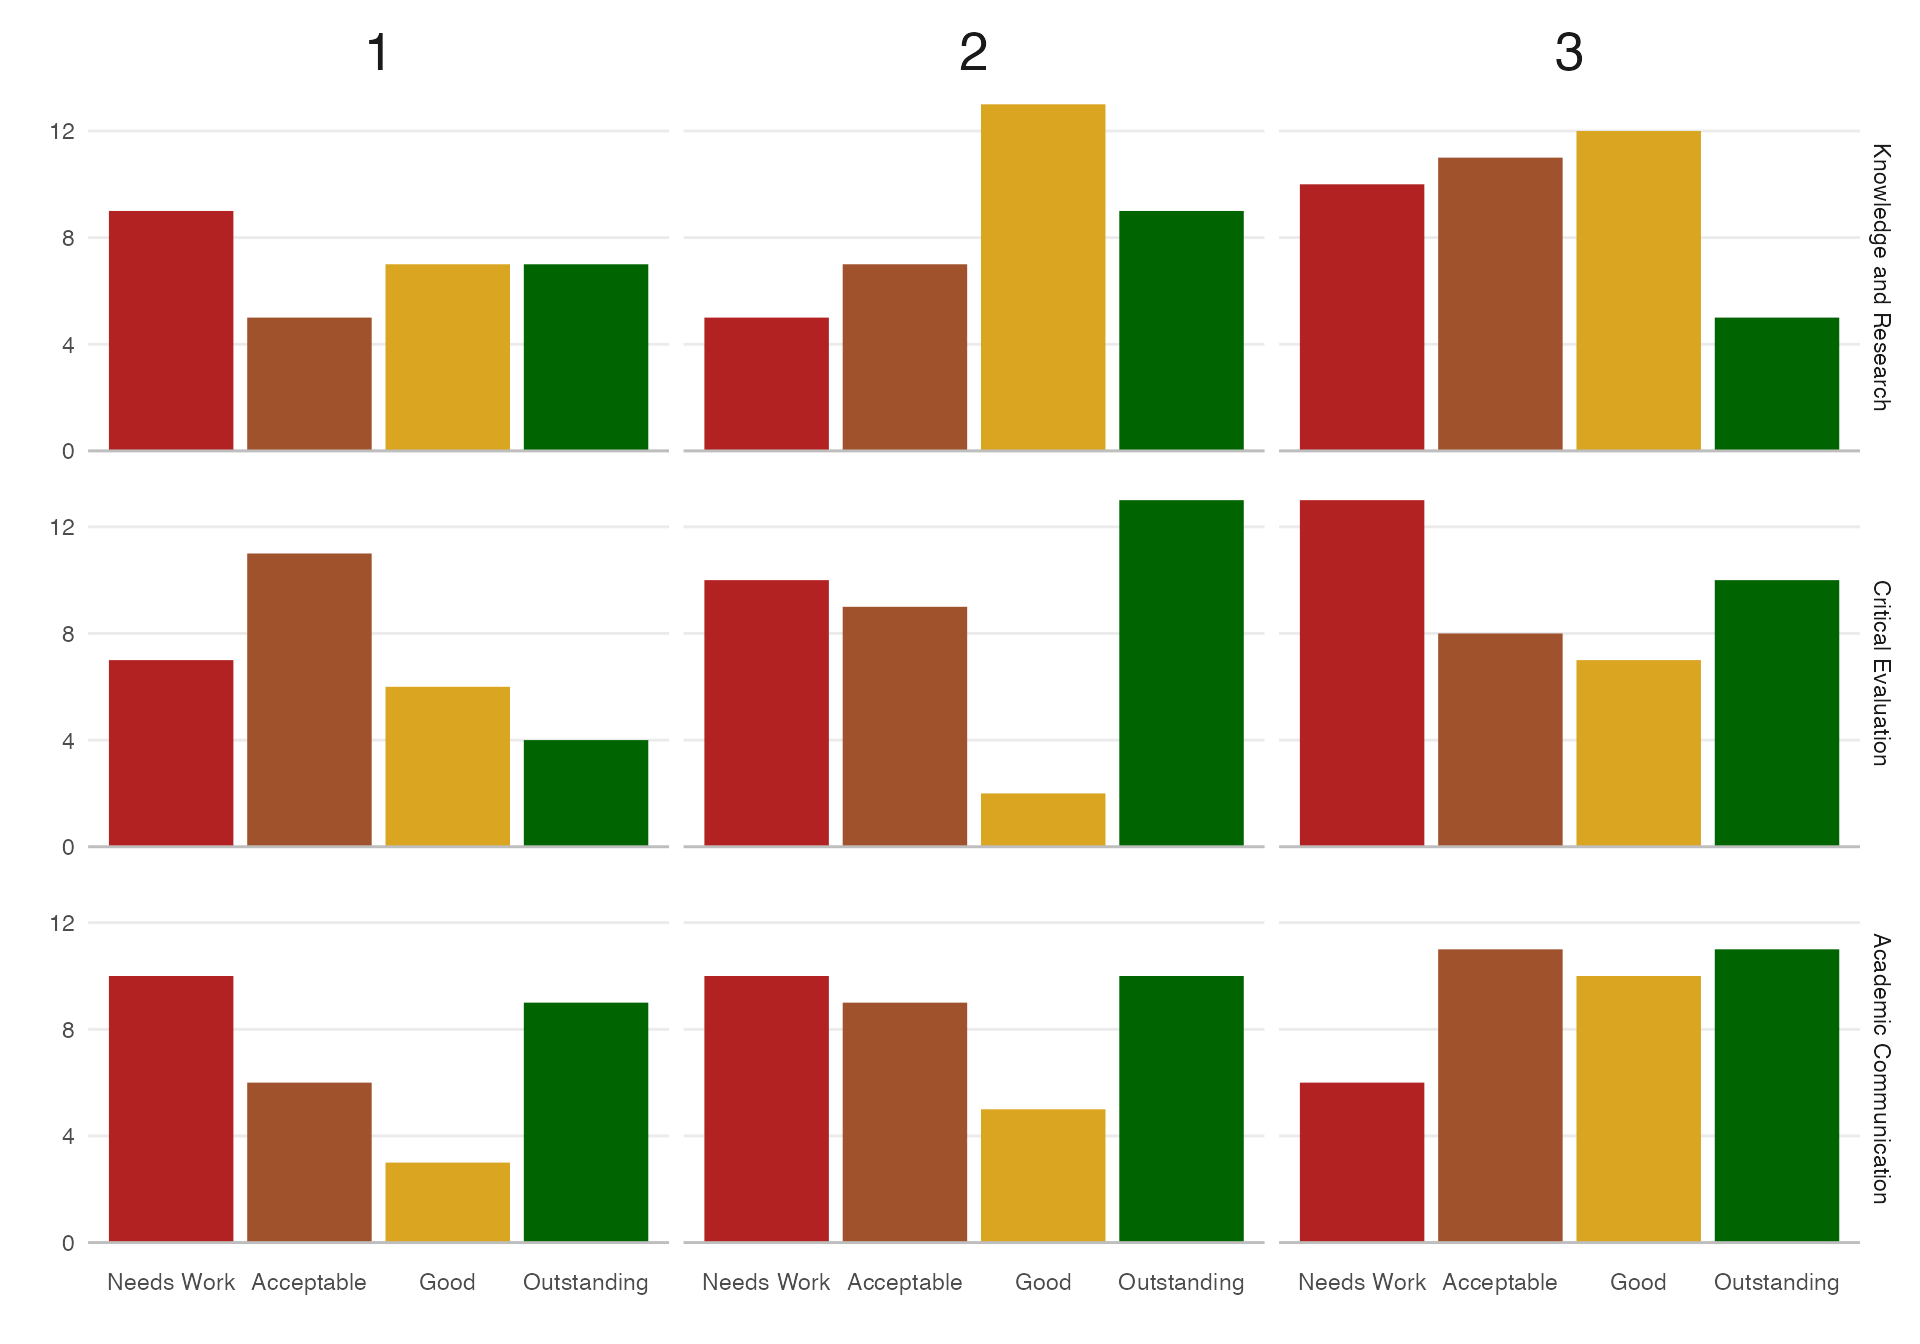
The default category plots are stacked bar plots. Set xaxis = "cat" to display the categories across the x-axis instead. The output is a ggplot object, so you can add further ggplot functions to customise your plots.
cat_dist(marks, cols, cats, xaxis = "cat",
         facet_by = "question") +
  scale_fill_manual(values = c("firebrick", "sienna", "goldenrod", "darkgreen")) +
  theme(strip.text.x = element_text(size = 20)) +
  scale_y_continuous(breaks = seq(0, 12, 4))
Glossary
| term | definition |
|---|---|
| argument | A variable that provides input to a function. |
| chunk | A section of code in an R Markdown file |
| directory | A collection or “folder” of files on a computer. |
| function | A named section of code that can be reused. |
| list | A container data type that allows items with different data types to be grouped together. |
| object | A word that identifies and stores the value of some data for later use. |
| panes | RStudio is arranged with four window “panes”. |
| r markdown | The R-specific version of markdown: a way to specify formatting, such as headers, paragraphs, lists, bolding, and links, as well as code blocks and inline code. |
| tabular data | Data in a rectangular table format, where each row has an entry for each column. |
| vector | A type of data structure that collects values with the same data type, like T/F values, numbers, or strings. |
| yaml | A structured format for information |