13 L
13.1 LaTeX
A typesetting program needed to create PDF files from R Markdown documents.
\({\LaTeX}\) is pronounced "lah-tech" or "lay-tech" (the X is a chi) and you can make the fancy version in R Markdown using this code:
${\LaTeX}$13.2 left_join
A mutating join that keeps all the data from the first (left) table and joins anything that matches from the second (right) table.
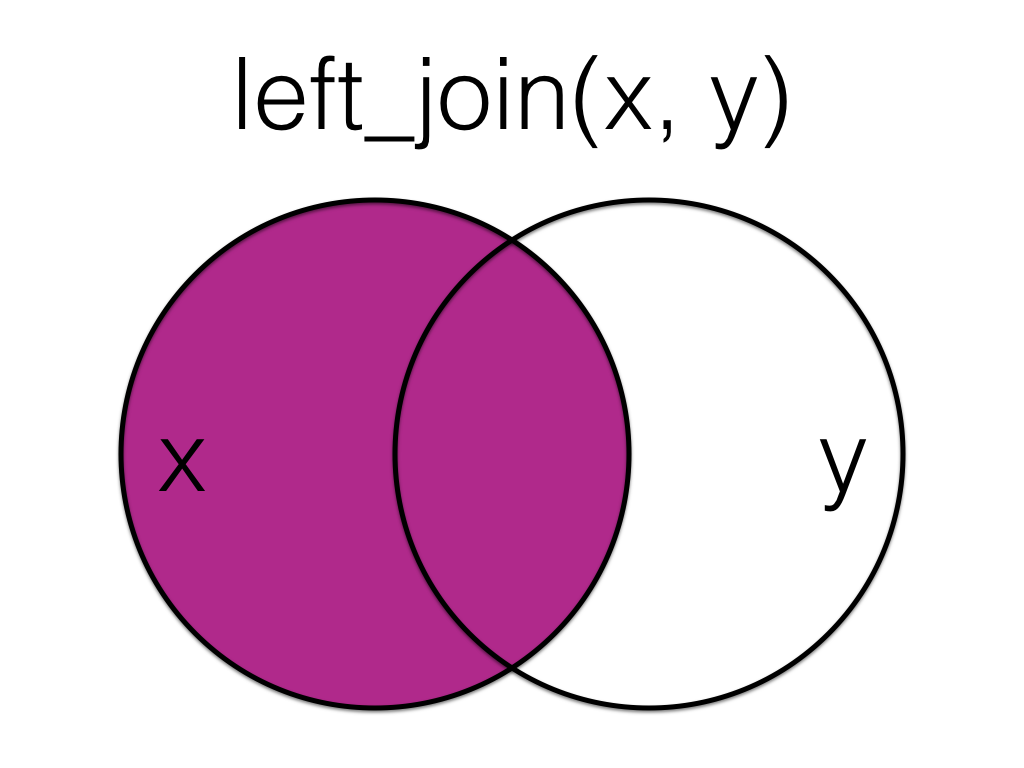
Figure 13.1: Left Join
More...
| Table X | Table Y | ||||||||||||||||||||||||
|---|---|---|---|---|---|---|---|---|---|---|---|---|---|---|---|---|---|---|---|---|---|---|---|---|---|
|
|
If there is no matching data in the right table for a row, the values are set to NA.
# X is the left table
data <- left_join(X, Y, by = "id")| id | x | y |
|---|---|---|
| 1 | A | NA |
| 2 | B | V |
| 3 | C | W |
| 4 | D | X |
| 5 | E | Y |
Order is important for left joins.
# Y is the left table
data <- left_join(Y, X, by = "id")| id | y | x |
|---|---|---|
| 2 | V | B |
| 3 | W | C |
| 4 | X | D |
| 5 | Y | E |
| 6 | Z | NA |
See joins for other types of joins and further resources.
13.3 level
The set of valid values for a factor
Setting the levels for a factor can be helpful to make sure they display and plot in the intended order.
# levels in the right order
day_levels <- c("Mon", "Tue", "Wed", "Thu", "Fri", "Sat", "Sun")

# repeat each day 1:7 times
days <- rep(day_levels, 1:7)

# make into factors with and without levels
without_levels <- factor(days)
with_levels <- factor(days, levels = day_levels)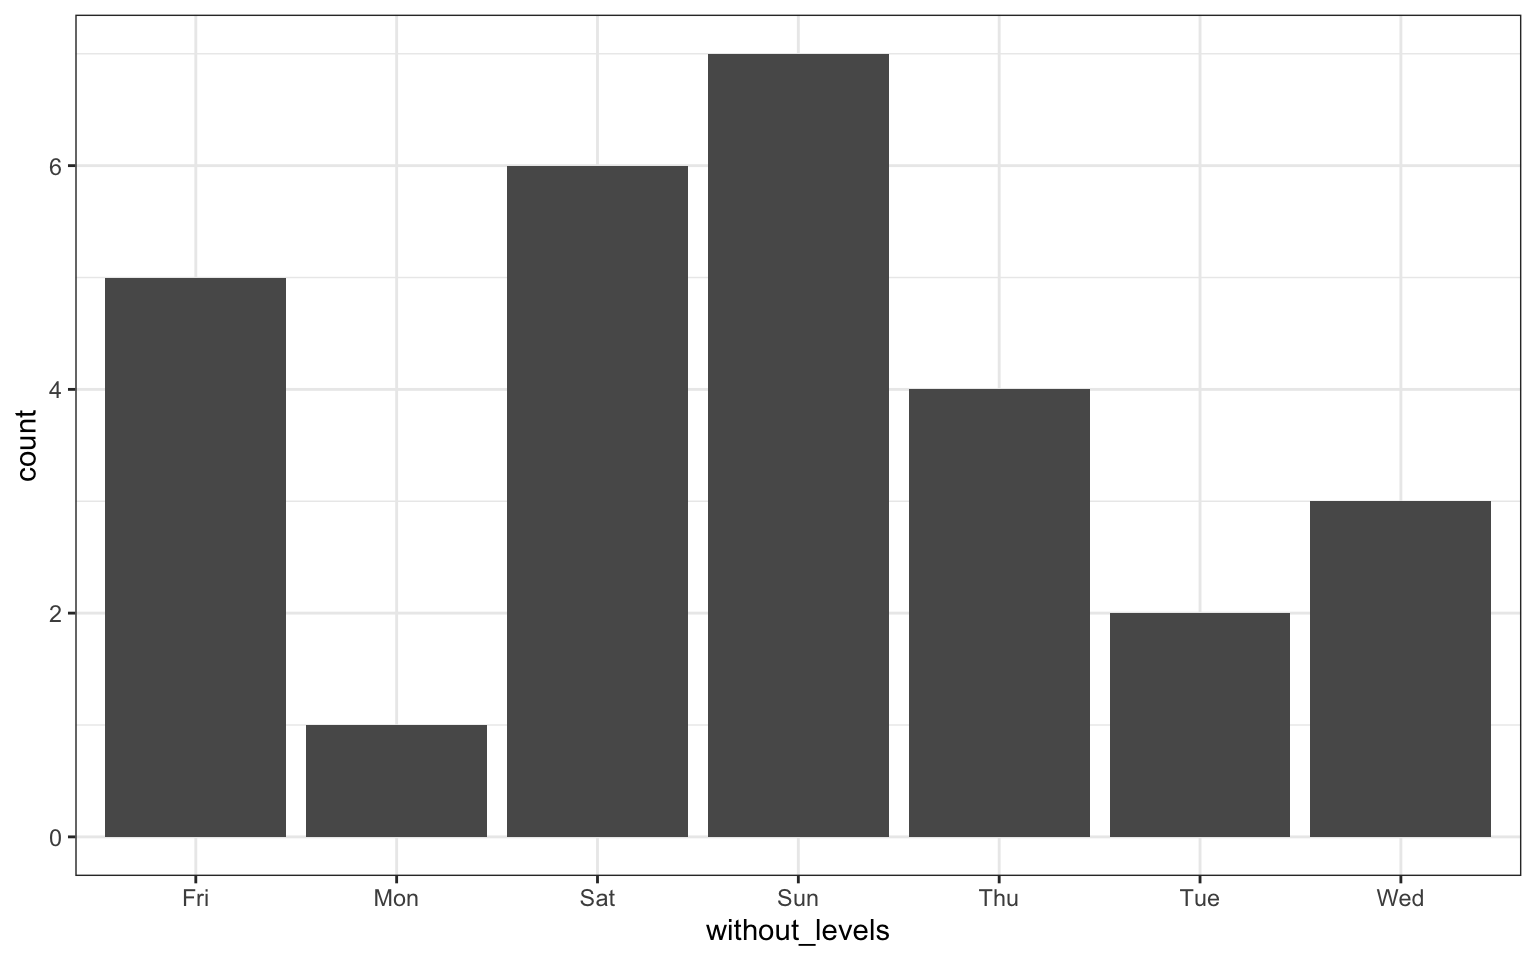
Figure 13.2: Without setting levels, categories display in alphabetical order.
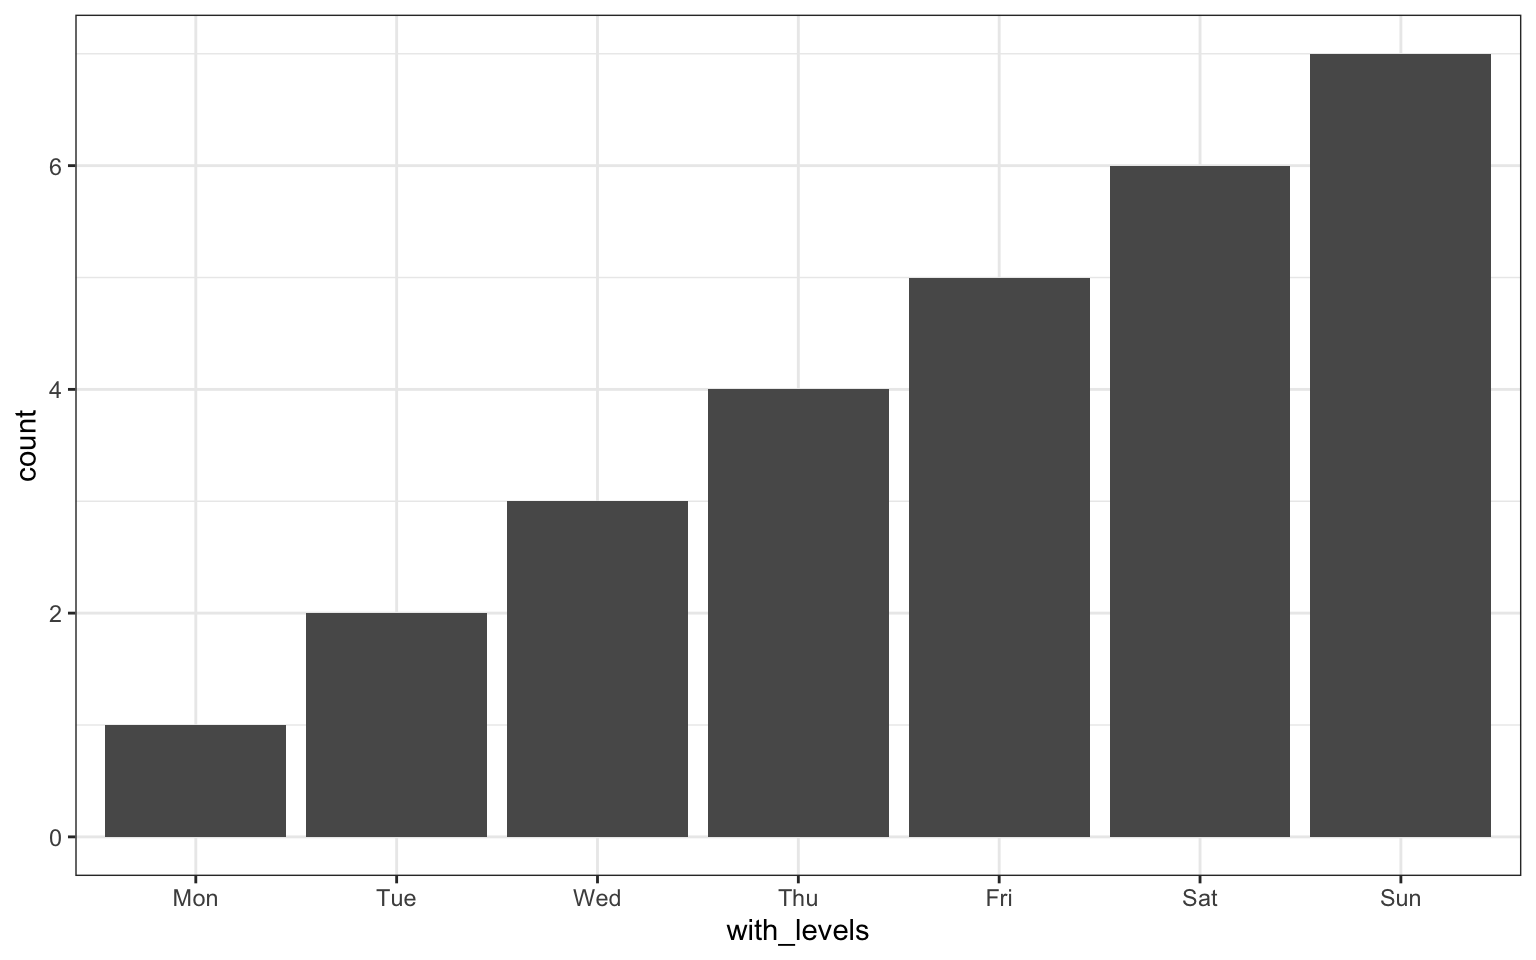
Figure 13.3: With setting levels, categories display in the level order
13.4 library
The function used to load packages or the directory where packages are stored.
13.5 library (function)
The function used to load packages.
You can use the library() function to load packages. This makes the functions in the package available to use without prefixing them with the package name.
If you try to use a non-prefixed function without loading its package, you will get an error like this:
glue("My name is {name}", name = "Lisa")
#> Error in glue("My name is {name}", name = "Lisa"): could not find function "glue"
You can use this function with its package prefix (helpfully, the glue() function comes from the glue package).
glue::glue("My name is {name}", name = "Lisa")
#> My name is Lisa
Or you can load the package with library() and use it without the prefix.
13.6 library (directory)
The directory where packages are stored.
Find out the location(s) where your packages are stored with the following code:
.libPaths()
#> [1] "/Library/Frameworks/R.framework/Versions/4.4-x86_64/Resources/library"
If you have problems installing packages, you may need to change your library location to a directory that you have permission to write to. You can do this by setting the library path.
# use a path relevant to your computer
.libPaths("/Users/myaccount/R/Library")
13.7 Likert
A rating scale with a small number of discrete points in order
An example of a Likert scale is the following:
| Question | 1 = Much less than average | 2 = Less than average | 3 = Average | 4 = More than average | 5 = Much more than average |
|---|---|---|---|---|---|
| I like R | |||||
| I like stats |
The points on Likert scales are ordinal, but not necessarily continuous. That is, you can assume 3 is higher than 2, but the difference between 2 and 3 isn't always the same as the difference between 1 and 2. Therefore, think carefully before averaging Likert values, since the average of 2 and 4 is not necessarily equal to 3.
13.8 Linear mixed-effects model
A type of regression model that involves estimating both fixed effects and random effects.
Most conventional regression models only estimate parameters associated with fixed effects and residual error. Mixed-effects models additionally estimate random effects parameters that capture variability associated with sampling units. In psychology, these sampling units are usually human participants or stimulus items.
Linear mixed-effects models are often called multi-level models or hierarchical models; these terms are roughly interchangeable. Linear mixed-effects models (LMEMs) are still linear models in the sense that they model a response variable in terms of a linear combination of predictor variables whose values are weighted by parameter estimates.
Because there is no closed form solution to finding the optimal parameter estimates, their values are typically estimated through an iterative procedure that searches the space of possible values for the optimum.
The function lmer() from the R package lme4 is often used to estimate mixed-effects models. The brms package in R allows Bayesian estimation of mixed-effects models.
13.9 list
A container data type that allows items with different data types to be grouped together.
Each item in a list can be any type of R object, but is usually a vector or another list.
list(
  integers = 1:10,
  strings = LETTERS,
  another_list = list(1, "A", TRUE),
  object = rnorm
)
#> $integers
#>  [1]  1  2  3  4  5  6  7  8  9 10
#>
#> $strings
#>  [1] "A" "B" "C" "D" "E" "F" "G" "H" "I" "J" "K" "L" "M" "N" "O" "P" "Q"
#> [18] "R" "S" "T" "U" "V" "W" "X" "Y" "Z"
#>
#> $another_list
#> $another_list[[1]]
#> [1] 1
#>
#> $another_list[[2]]
#> [1] "A"
#>
#> $another_list[[3]]
#> [1] TRUE
#>
#>
#> $object
#> function (n, mean = 0, sd = 1)
#> .Call(C_rnorm, n, mean, sd)
#> <bytecode: 0x7f7994098988>
#> <environment: namespace:stats>
13.10 literal
The actual character being typed, not the special meaning it has to code.
R and markdown have some characters that are used for code or formatting, making them difficult to use literally in the text. You can escape characters to use the literal version.
13.11 logical
A data type representing TRUE or FALSE values.
Sometimes also called boolean
true_logical_values <- list(
  full = TRUE,
  abbreviated = T,
  integer = as.logical(1),
  equation = "A" == "A"
)
str(true_logical_values)
#> List of 4
#>  $ full       : logi TRUE
#>  $ abbreviated: logi TRUE
#>  $ integer    : logi TRUE
#>  $ equation   : logi TRUE
false_logical_values <- list(
  full = FALSE,
  abbreviated = F,
  integer = as.logical(0),
  equation = "A" == "B"
)

str(false_logical_values)
#> List of 4
#>  $ full       : logi FALSE
#>  $ abbreviated: logi FALSE
#>  $ integer    : logi FALSE
#>  $ equation   : logi FALSE
13.12 long
A data format where each observation is on a separate row
| id | item | value |
|---|---|---|
| A | Q1 | 1 |
| B | Q1 | 4 |
| A | Q2 | 2 |
| B | Q2 | 5 |
| A | Q3 | 3 |
| B | Q3 | 6 |
Contrast with wide data format.