Tools for Science
This tutorial will show you how Shiny can also be used to build handy apps which can be used in research and teaching. As an example, we will be building a simple app which will help us calculate the visual angle of a stimulus. I’d recommend you complete the earlier Shiny tutorials (Creating your first app and Data collection) as we’ll be building on that knowledge here.
This tutorial will also introduce reactivity, which refers to how the app will react to the user’s input, and shinydashboard, a package which lets us build much more visually pleasing and user-friendly Shiny apps.
Tutorial Slides (.pptx format)
Try the Demo App
Try the simple Visual Angle app. You’ll have something very similar built by the end of this tutorial.
Setup
First of all, we’ll need to install the necessary packages (especially shinydashboard), create our shiny project, and check everything runs okay…
Install shinydashboard
This tutorial uses shinydashboard. If you’ve not already done so, install the latest version of shinydashboard with:
install.packages("shinydashboard")New Shiny Project
Create a new Shiny Web Application project, and name it something like, “Visual-Angle-Calculator”. For a reminder of how to do this, have a look at the Creating your First App tutorial.
Replace the default code
As in the first tutorial, this will display the code for the default demo app. Delete all of the default code, and replace it with the following (or download the scaffolding file below):
library(shiny)
library(shinydashboard)
library(tidyverse)

# function for calculating visual angle
get_va <- function(size, distance, approx=F){
  if (approx) {
    rad <- atan(size/distance)
  } else {
    rad <- 2*atan(size/(2*distance))
  }
  rad*(180/pi)  # radians to angle
}
# function for converting to consistent units (mm)
to_mm <- function(val, units){
  recode(
    units,
    "mm"=as.double(val),
    "cm"=as.double(val)*10,
    "inches"=as.double(val)*25.4
  )
}


ui <- dashboardPage(

  skin = "purple",

  dashboardHeader(),

  dashboardSidebar(),

  dashboardBody()

)

server <- function(input, output) {


}

shinyApp(ui = ui, server = server)Run the App
Click on Run App in the top right corner of the source pane, or enter shiny::runApp() in the console. You’ll notice that so far we just have an empty app.
Building the UI - Basics
The shinydashboard UI consists of three main parts, given as arguments to the dashboardPage() function:
the header,
dashboardHeader()the sidebar,
dashboardSidebar()the main body,
dashboardBody()
Choose a Skin
We’ll start by choosing a skin for the app. In the dashboardPage() function, change skin = "purple" to a colour of your choice. To see all the available skin colours, see the shinydashboard documentation. Run the app to see how this affects the app’s appearance.
Choose a Title
Next we’ll choose a title for the app. In the dashboardHeader() function, enter title = "My App Title". Run the app to see how this affects the app’s appearance. Your title may be too long to display, in which case, see here.
Building the UI - Body
By now your App should look something like this:
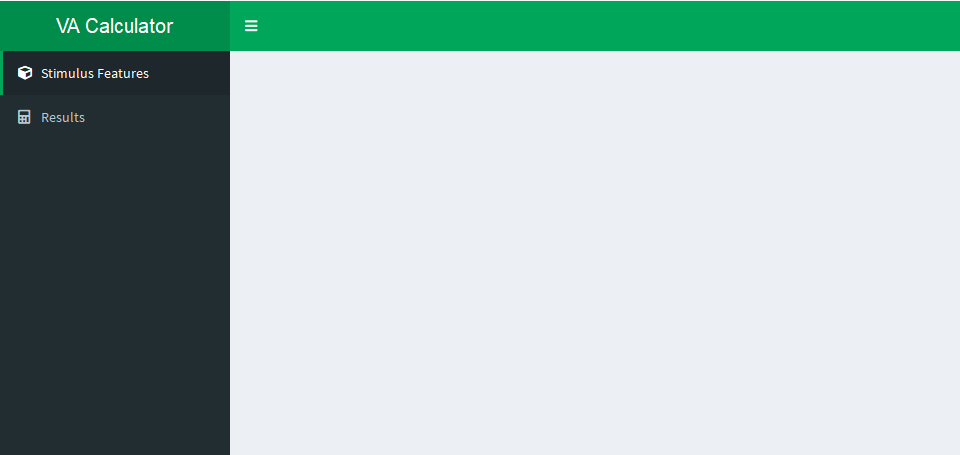
The next step is to build the body for our tabs.
Tab Items
The content for different tabs is created using the tabItems() function. Each tab is then described using the tabItem() function, embedded inside tabItems().
Change the dashboardBody() function to include the tabItems function, and describe the stimulus features tab like so:
dashboardBody(
  tabItems(
    tabItem(
      tabName = "stim-features",
      fluidRow(
        # the tab's content will go in here
      )
    )
  )
)
Note that the tabItem() function “knows” which tab you are referring to because of the tabName argument, so make sure this matches the tab name you gave the stimulus features tab (above).
New tabs are created by giving additional tabItem() functions as arguments to tabItems().
Boxes
A distinctive feature of shinydashboard is boxes. These are a really easy way of organising your content in Shiny Apps. We can create a box using the box() argument, and putting it inside the fluidRow() function for the stimulus features tab.
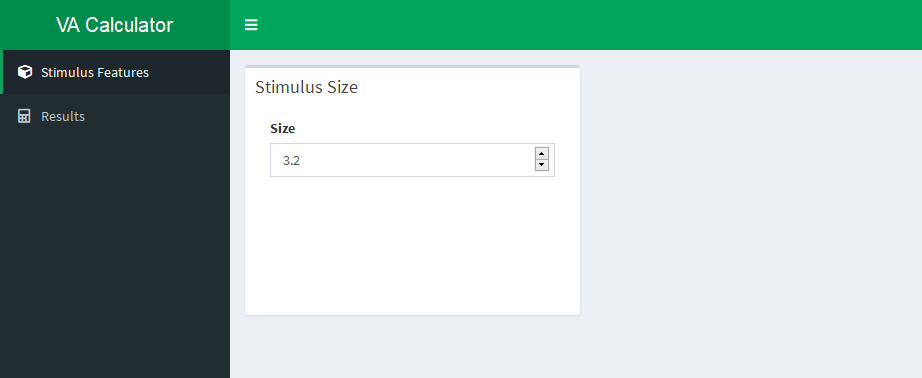
Replace the section of your code that reads, # the tab's content will go in here, with the following:
box(
  width = 6,  # an integer between 1 and 12, where 1 is 1/12 of the possible width
  title = "Stimulus Size",
  numericInput("size", "Size", value=3.2, min=0.01, step=0.01, width="100%")
)
Your App’s Stimulus Features tab should now look something like this:
Box Content
Have another look at the example app. Let’s include the drop-down menu that lets you select the measurement units for your Stimulus Size. Make sure to give “cm”, “mm”, and “inches” as options. Set the inputId argument to something like "size_units". For a refresher, see selectInput() from the last tutorial.
Show Solution…
selectInput("size_units", "Units", c("cm", "mm", "inches"))
Adding New Boxes
Let’s add the next box on the Stimulus Features tab, which will be used to input the distance of the stimulus from the participant. After the bracket which closes the box() function for our stimulus size box, add a comma (and new line for neatness), and create another box().
Most of the arguments can then be copied over, but make sure to change the title, and the inputId and label arguments for the user input.
Show Solution…
box(
  width = 6,  # an integer between 1 and 12, where 1 is 1/12 of the possible width
  title = "Stimulus Distance",
  numericInput("distance", "Distance", value=3.2, min=0.01, step=0.01, width="100%"),
  selectInput("distance_units", "Units", c("cm", "mm", "inches"))
)
Server Logic
Now that we have our basic UI built, we want to calculate our reactive values, and then render the output in our app’s results tab. Anything calculated after the app first initialises needs to be calculated in the server. These values are reactive in the sense that they react to the user’s input. Reactivity is the most confusing thing about shiny, but also the coolest.
Give the Features Consistent Units
Since the user could have theoretically given their stimulus’ size in mm, but its distance in inches, the first step is to put these in consistent units. Thankfully, we have a handy to_mm() function, which takes two arguments: a numeric value, and its current units (“mm”, “cm”, “inches”). The function returns a single numeric value, which is the same value but in mm.
As an example:
to_mm(29, "inches")## [1] 736.6How Reactive Values work:
Reactive values are essentially functions, which provide the current reactive value as output when evaluated (e.g.
myValue()).The user’s input is handily stored in a list object called
input. Specific values can be extracted withinput$inputID.Reactive values are assigned in the form
myValue <- reactive({ 2 * input$userNumber }).
To get our stimulus size and distance values, we can add something like this to our server, referencing the user’s values with the inputIDs we added in our UI:
stim_size <- reactive({
  to_mm(input$size, input$size_units)
})

stim_distance <- reactive({
  to_mm(input$distance, input$distance_units)
})Calculate Visual Angle
We can now use these reactive values to calculate another reactive value, the visual angle of the stimulus:
visual_angle <- reactive({
  get_va(stim_size(), stim_distance())
})Render Results Reactively
Now we have the visual angle calculated, we just need to show it to the user. To do this, there are a number of “render” functions, which allow us to render UI features reactively. For example, renderPlot() lets us show the user a reactively-rendered graph. These render functions work similarly to the reactive() function.
As we just want to show the user the output, we’re going to render an infoBox (similar to a valueBox), with the renderInfoBox() function.
output$results_box <- renderInfoBox({
  infoBox(
    "Visual Angle", paste0(visual_angle(), " degrees"),
    icon=icon("eye"), color="purple"
  )
})Adding New Tabs’ Content
If you run the app now, you’ll notice that we get a whole lot of nothing on the results tab. This is because we’ve rendered the info box with our results, but we still need to say where we want to put it. Put a comma after the last tabItem, and add the following code.
tabItem(
  tabName = "results",
  fluidRow(
    infoBoxOutput("results_box"),
    tags$style("#results_box {width:100%;}")
  )
)
Note: The tags$style() function is an example of inline css in our code. In this example we’re styling our info box to have a width of 100%
Conclusion
They might seem confusing, but shiny and shinydashboard are great ways to create interactive apps to help solve common problems (or demonstrate difficult ideas) in Science, which require your users to have minimal or no coding experience in R. Shinydashboard in particular makes it easy to build a professional-looking and intuitive UI. Your shiny apps can work great as standalone applications, or can be built into your packages to provide a friendlier face to your users.
Bonus Material
Iterative UI Generation
This is something I planned on covering but didn’t have enough time to include. Often I find that I want to build several very similar UI features. Rather than just copy and pasting the code, it’s possible to build the elements iteratively. This can make your code much easier to read and debug. One way of doing this is with a lapply() loop:
lapply(1:15, function(i){
  box(
    width = 6,
    title = paste("Box Number", i, sep=" "),
    paste("Box ", i, "'s content will go here...", sep="")
  )
})