
 [1] "A" "B" "A" "B" "A" "B" "A" "B" "A" "B" "A" "B" "A" "B" "A" "B" "A" "B" "A"
[20] "B" "A" "B" "A" "B"8 Iteration
Intended Learning Outcomes
Setup
- Open your
reproresproject - Create a new quarto file called
08-iteration.qmd - Update the YAML header
- Replace the setup chunk with the one below:
Download the Apply functions with purrr cheat sheet.
8.1 Simple iteration functions
In the next two lectures, we are going to learn more about iteration (doing the same commands over and over) and custom functions through a data simulation exercise, which will also prepare us more traditional statistical topics. We first learned about the two basic iteration functions, rep() and seq() in the Working with Data chapter.
8.1.1 rep()
The function rep() lets you repeat the first argument a number of times.
Use rep() to create a vector of alternating "A" and "B" values of length 24.
If you don’t specify what the second argument is, it defaults to times, repeating the vector in the first argument that many times. Make the same vector as above, setting the second argument explicitly.
 [1] "A" "B" "A" "B" "A" "B" "A" "B" "A" "B" "A" "B" "A" "B" "A" "B" "A" "B" "A"
[20] "B" "A" "B" "A" "B"
If the second argument is a vector that is the same length as the first argument, each element in the first vector is repeated than many times. Use rep() to create a vector of 11 "A" values followed by 3 "B" values.
You can repeat each element of the vector a sepcified number of times using the each argument, Use rep() to create a vector of 12 "A" values followed by 12 "B" values.
 [1] "A" "A" "A" "A" "A" "A" "A" "A" "A" "A" "A" "A" "B" "B" "B" "B" "B" "B" "B"
[20] "B" "B" "B" "B" "B"
What do you think will happen if you set both times to 3 and each to 2?
8.1.2 seq()
The function seq() is useful for generating a sequence of numbers with some pattern.
Use seq() to create a vector of the integers 0 to 10.
You can set the by argument to count by numbers other than 1 (the default). Use seq() to create a vector of the numbers 0 to 100 by 10s.
The argument length.out is useful if you know how many steps you want to divide something into. Use seq() to create a vector that starts with 0, ends with 100, and has 12 equally spaced steps (hint: how many numbers would be in a vector with 2 steps?).
8.1.3 replicate()
You can use the replicate() function to run a function n times.
For example, you can get 3 sets of 5 numbers from a random normal distribution by setting n to 3 and expr to rnorm(5).
           [,1]       [,2]       [,3]
[1,]  1.0240772  1.0030439  1.5912356
[2,] -0.4327152  0.2342534  1.0063919
[3,]  0.4384483 -0.1217803 -1.7631158
[4,] -1.4106443 -0.3635024 -1.0988308
[5,]  0.9016948  0.5873456  0.7136377
By default, replicate() simplifies your result into a matrix that is easy to convert into a table if your function returns vectors that are the same length. If you’d rather have a list of vectors, set simplify = FALSE.
8.2 Complex iteration functions
purrr::map() and lapply() return a list of the same length as a vector or list, each element of which is the result of applying a function to the corresponding element. They function much the same, but purrr functions have some optimisations for working with the tidyverse. We’ll be working mostly with purrr functions in this course, but apply functions are very common in code that you might see in examples on the web.
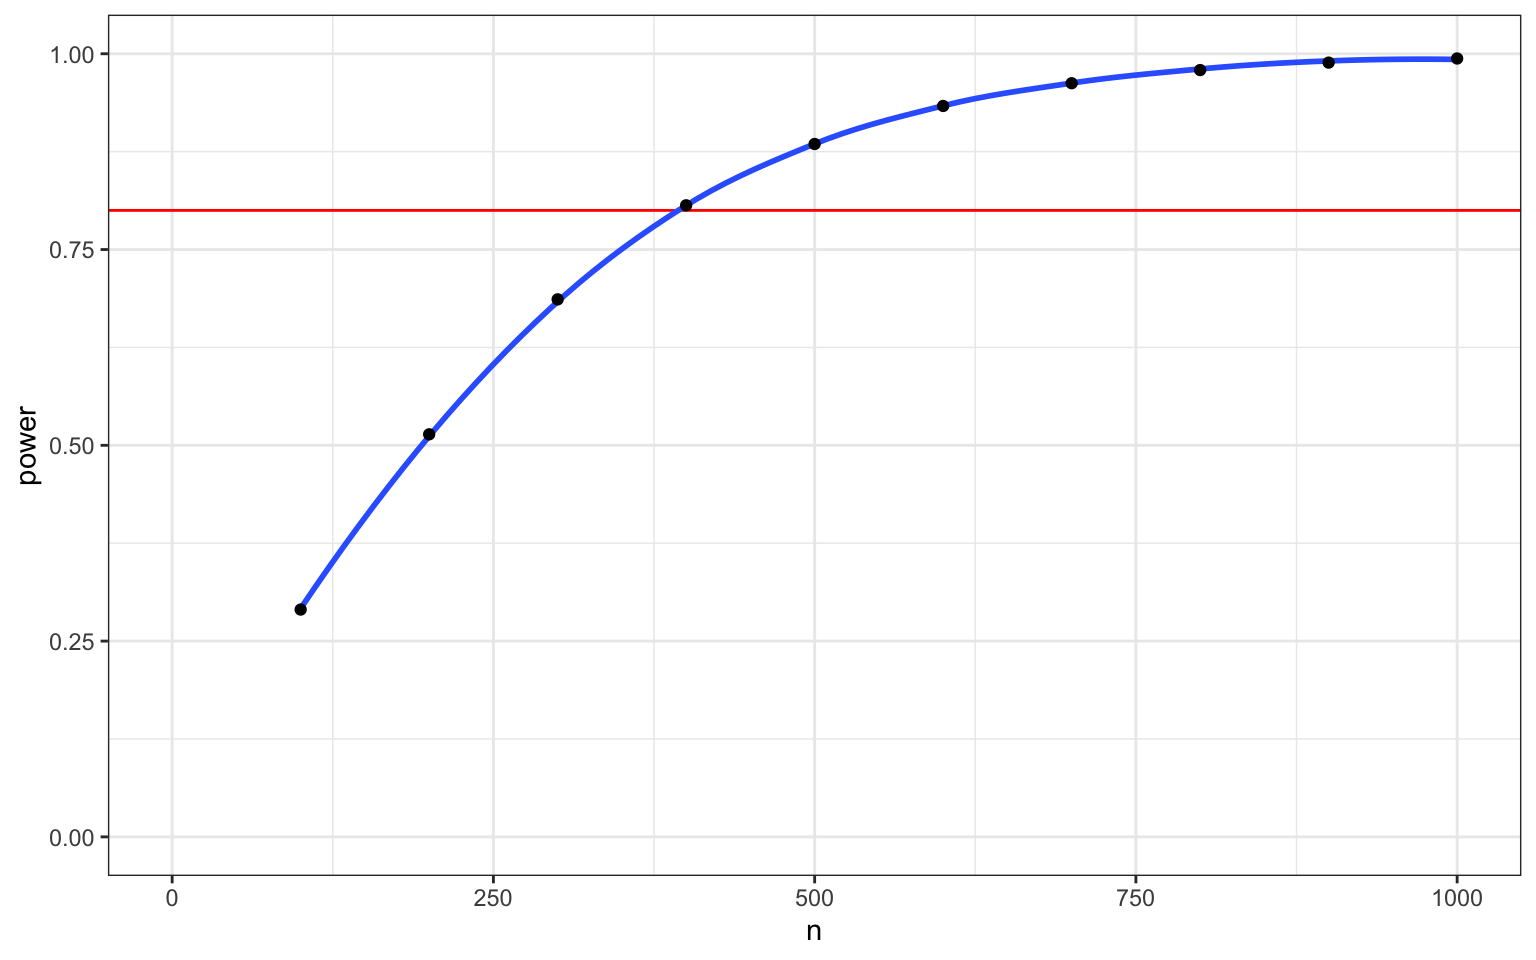
Imagine you want to calculate the power for a two-sample t-test with a mean difference of 0.2 and SD of 1, for all the sample sizes 100 to 1000 (by 100s). You could run the power.t.test() function 20 times and extract the values for “power” from the resulting list and put it in a table.
| n | power |
|---|---|
| 100 | 0.290266404572216 |
| … | … |
| 1000 | 0.884788352886661 |
However, the apply() and map() functions allow you to perform a function on each item in a vector or list. First make an object n that is the vector of the sample sizes you want to test, then use lapply() or map() to run the function power.t.test() on each item. You can set other arguments to power.t.test() after the function argument.
These functions return a list where each item is the result of power.t.test(), which returns a list of results that includes the named item “power”. This is a special list that has a summary format if you just print it directly:
     Two-sample t test power calculation

              n = 100
          delta = 0.2
             sd = 1
      sig.level = 0.05
          power = 0.2902664
    alternative = two.sided

NOTE: n is number in *each* group
But you can see the individual items using the str() function.
List of 8
 $ n          : num 100
 $ delta      : num 0.2
 $ sd         : num 1
 $ sig.level  : num 0.05
 $ power      : num 0.29
 $ alternative: chr "two.sided"
 $ note       : chr "n is number in *each* group"
 $ method     : chr "Two-sample t test power calculation"
 - attr(*, "class")= chr "power.htest"
sapply() is a version of lapply() that returns a vector or array instead of a list, where appropriate. The corresponding purrr functions are map_dbl(), map_chr(), map_int() and map_lgl(), which return vectors with the corresponding data type.
You can extract a value from a list with the function [[. You usually see this written as pcalc[[1]], but if you put it inside backticks, you can use it in apply and map functions.
 [1] 0.2902664 0.5140434 0.6863712 0.8064964 0.8847884 0.9333687 0.9623901
 [8] 0.9792066 0.9887083 0.9939638
We use map_dbl() here because the value for “power” is a double.
 [1] 0.2902664 0.5140434 0.6863712 0.8064964 0.8847884 0.9333687 0.9623901
 [8] 0.9792066 0.9887083 0.9939638
We can use the map() functions inside a mutate() function to run the power.t.test() function on the value of n from each row of a table, then extract the value for “power”, and delete the column with the power calculations.
8.3 Exercises
- “A” “B” “C” “D” “A” “B” “C” “D”
- “A” “A” “B” “B” “C” “C” “D” “D”
- “A” “A” “B” “B” “C” “C” “A” “A” “B” “B” “C” “C”
- 4 9 14 19 24 29 34 39 44 49 54 59
- 0.00000 33.33333 66.66667 100.00000
- 0 20 40 60 80 100 0 20 40 60 80 100
- How many different ways can you think of to create the following table?
| id | condition | manipulation |
|---|---|---|
| 101 | ctl | A |
| 201 | ctl | B |
| 301 | ctl | C |
| 401 | ctl | D |
| 501 | exp | A |
| 601 | exp | B |
| 701 | exp | C |
| 801 | exp | D |
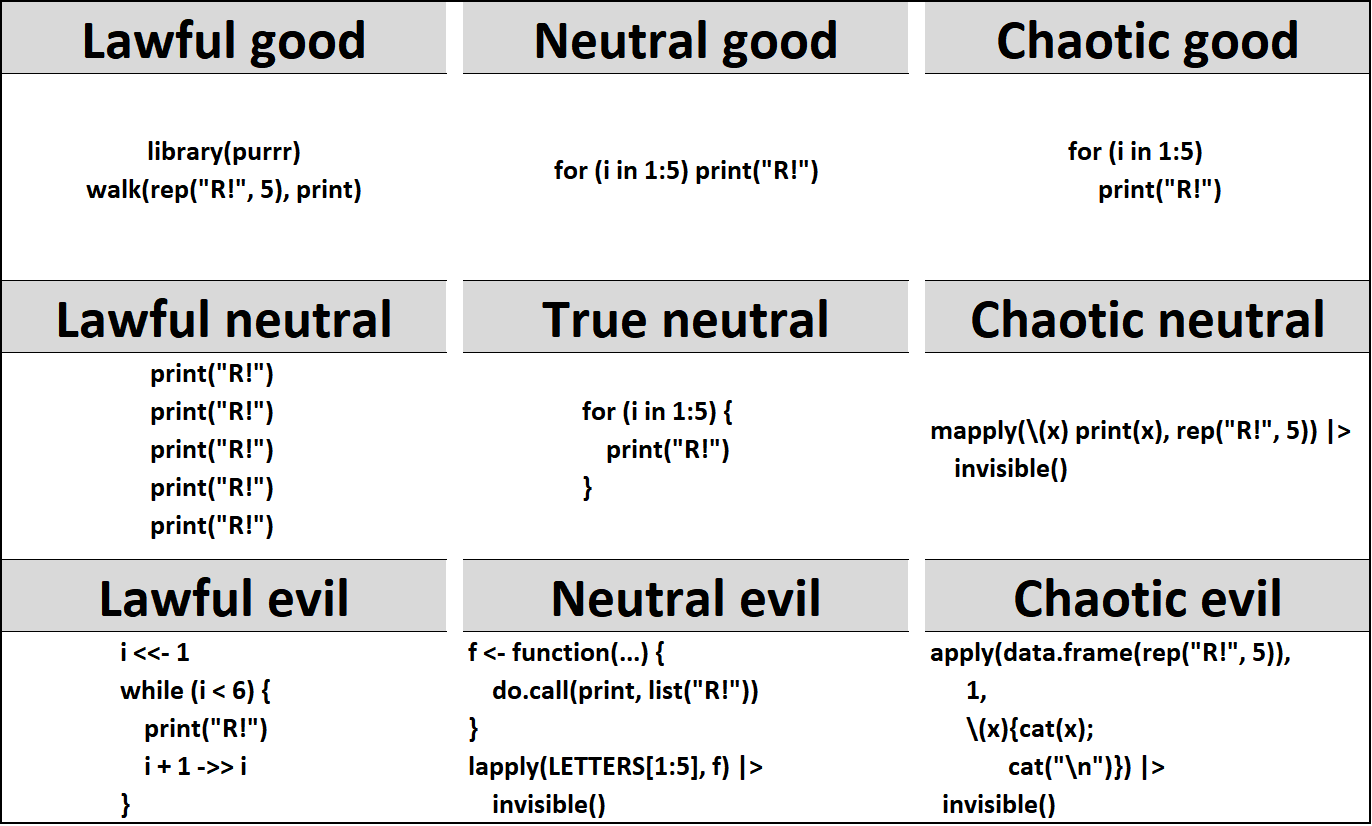
- Explain why this meme is funny.
- Lawful good
r library(purrr) walk(rep("R!", 5), print) - Neutral good
r for (i in 1:5) print("R!") - Chaotic good
r for (i in 1:5) print("R!") - Lawful neutral
r print("R!") print("R!") print("R!") print("R!") print("R!") - True neutral
r for (i in 1:5) { print("R!") } - Chaotic neutral
r mapply(\(x) print(x), rep("R!", 5)) |> invisible() - Lawful evil
r i <<- 1 while (i < 6) { print("R!") i + 1 ->> i } - Neutral evil
r f <- function(...) { do.call(print, list("R!")) } lapply(LETTERS[1:5], f) |> invisible() - Chaotic evil
r apply(data.frame(rep("R!", 5)), 1, \(x){cat(x); cat("\n")}) |> invisible()
Glossary
| term | definition |
|---|---|
| data-type | The kind of data represented by an object. |
| double | A data type representing a real decimal number |
| function | A named section of code that can be reused. |
| iteration | Repeating a process or function |
| matrix | A container data type consisting of numbers arranged into a fixed number of rows and columns |
Further Resources
- Chapters 21 of R for Data Science
- Apply functions with purrr cheat sheet