10 I
10.1 IDE
Integrated Development Environment: a program that serves as a text editor, file manager, and provides functions to help you read and write code. RStudio is an IDE for R.
10.2 %in%
The match operator, a binary operator that returns a logical vector indicating if there is a match or not for its left operand.
10.3 independent variable
A variable whose value is assumed to influence the value of a dependent variable.
This term is often used in an experimental context. In a regression context, this is equivalent in meaning to predictor variable.
10.4 index
The number that represents an element's location in a vector.
For example, the index of the letter E in the vector LETTERS is 5.
This can also refer to the main page of a website. For example, the address for the main page of the glossary is technically https://psyteachr.github.io/glossary/index.html (but https://psyteachr.github.io/glossary/ invisibly directs you to the index page).
10.5 Inf
A value representing infinity
In R infinity is represented with the symbol Inf. Use the function is.infinite() to check if values are infinite.
value <- 1/0
value
#> [1] Inf
is.infinite(1/0)
#> [1] TRUE
# negative infinity
value <- -1/0
value
#> [1] -Inf
is.infinite(1/0)
#> [1] TRUE
10.6 inferential
Statistics that allow you to make predictions about or comparisons between data (e.g., t-value, F-value, rho)
Contrast with descriptive statistics.
10.7 inner-join
A mutating join that returns all the rows that have a match in the other table.
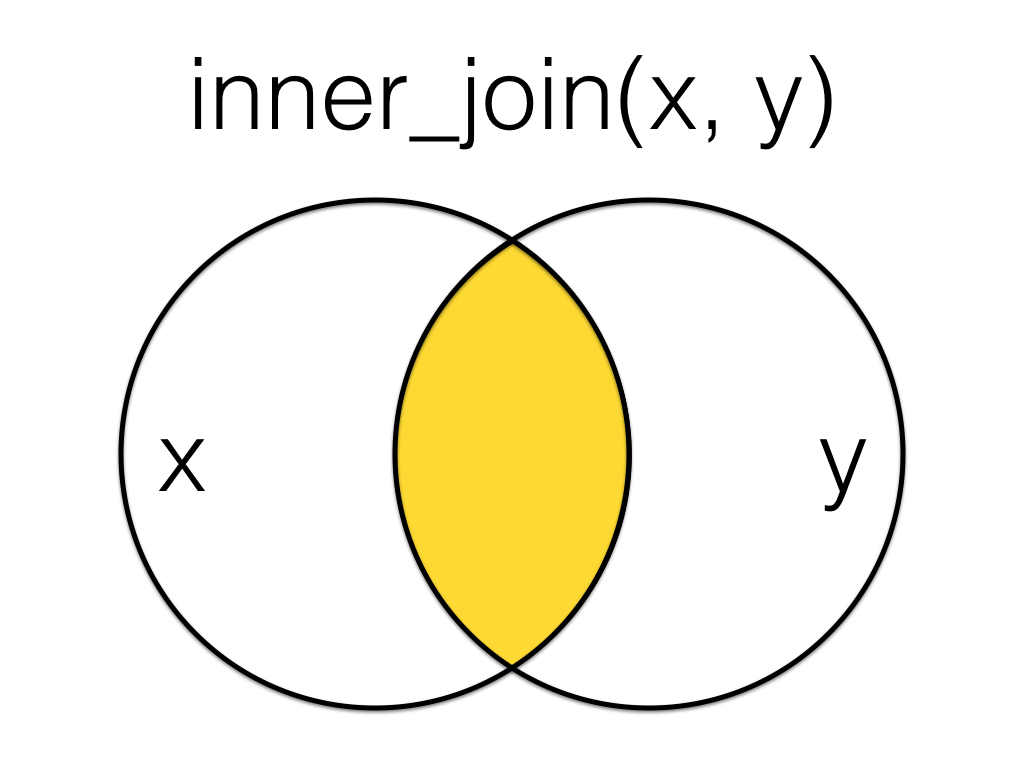
Figure 10.1: Inner Join
More...
| Table X | Table Y | ||||||||||||||||||||||||
|---|---|---|---|---|---|---|---|---|---|---|---|---|---|---|---|---|---|---|---|---|---|---|---|---|---|
|
|
# X columns come first
data <- inner_join(X, Y, by = "id")| id | x | y |
|---|---|---|
| 2 | B | V |
| 3 | C | W |
| 4 | D | X |
| 5 | E | Y |
Order is not important for inner joins, but does change the order of columns in the resulting table.
# Y columns come first
data <- inner_join(Y, X, by = "id")| id | y | x |
|---|---|---|
| 2 | V | B |
| 3 | W | C |
| 4 | X | D |
| 5 | Y | E |
See joins for other types of joins and further resources.
10.8 integer
A data type representing whole numbers.
In R, you specify that a number is an integer by adding an L at the end, like 1L, -36L, or 100L.
10.9 intercept
Also referred to as y-intercept, this is a constant corresponding to the value of the \(y\) variable (in a regression context, the response variable) when all predictor variables are set to zero.
The value of the intercept is the predicted value when all other model terms are equal to zero. Therefore, it depends on how groups are coded and whether covariates are centered.
More...
For example, the code below shows data sampled from two distributions with means of 100 and 105. Two different contrast coding schemes are used to code the group variable: treatment and sum.
set.seed(8675309) # for reproducibility

control <- rnorm(n = 50, mean = 100, sd = 10)
experimental <- rnorm(n = 50, mean = 105, sd = 10)

df <- tibble(
  dv = c(control, experimental),
  group = rep(c("control", "experimental"), each = 50),
  treatment = recode(group, control = 0, experimental = 1),
  sum = recode(group, control = -1, experimental = 1)
)
Treatment coding codes the baseline group as 0, so the intercept is equal to the predicted mean value for this group.
model_t <- lm(dv ~ treatment, data = df)

summary(model_t)$coefficients
#>               Estimate Std. Error   t value     Pr(>|t|)
#> (Intercept) 101.026918   1.318732 76.609163 2.930242e-89
#> treatment     3.992219   1.864968  2.140637 3.478461e-02
For two groups, sum coding codes one group as -1 and the other as +1, so the intercept is equal to the mean of the predicted mean values for each group.
10.10 iteration
Repeating a process or function
Repeating a process or function is useful when we want to perform the same operation on each element in a list or vector.
For example, you may want to check the power of a two-sample t-test to detect an effect size of 0.2 for all of the possible sample sizes between 100 and 1000, incrementing by 100. You can "iterate" over the values of n to get the power for each n.
n_range <- seq(100, 1000, 100)
power <- c() # make an empty vector

for (n in n_range) {
  pcalc <- power.t.test(n = n, delta = 0.2, sd = 1,
                      type = "two.sample")
  power <- c(power, pcalc$power)
}

power
#>  [1] 0.2902664 0.5140434 0.6863712 0.8064964 0.8847884 0.9333687 0.9623901
#>  [8] 0.9792066 0.9887083 0.9939638
Many functions are "vectorized" such that they return a vector of results if you use a vector for an argument. The function itself takes care of the iteration for you.
pcalc <- power.t.test(n = n_range,
                      delta = 0.2, sd = 1,
                      type = "two.sample")
power <-  pcalc$power
power
#>  [1] 0.2902664 0.5140434 0.6863712 0.8064964 0.8847884 0.9333687 0.9623901
#>  [8] 0.9792066 0.9887083 0.9939638
You can also use apply() or map() functions to apply a single function to each element of a vector or list.
# apply power.t.test to each n and return a list of lists
pcalc <- map(.x = n_range, # vector to iterate over
             .f = power.t.test, # function to apply
             # other arguments to the function
             delta = 0.2, sd = 1,
             type="two.sample")

# extract the "power" element from each element in pcalc
# and return a vector of doubles
power <- map_dbl(pcalc, getElement, "power")
power
#>  [1] 0.2902664 0.5140434 0.6863712 0.8064964 0.8847884 0.9333687 0.9623901
#>  [8] 0.9792066 0.9887083 0.9939638