3 Data wrangling II
Intended Learning Outcomes
By the end of this chapter, you should be able to:
- apply familiar data wrangling functions to novel datasets
- read and interpret error messages
- realise there are several ways of getting to the results
In this chapter, we will pick up where we left off in Chapter 2. We will calculate average scores for two of the questionnaires, address an error mode problem, and finally, join all data objects together. This will finalise our data for the upcoming data visualization sections (Chapter 4 and Chapter 5).
Individual Walkthrough
3.1 Activity 1: Setup
- Go to the project folder we have been using in the last two weeks and double-click on the project icon to open the project in RStudio
- Either Create a new
.Rmdfile for chapter 3 and save it to your project folder or continue the one from last week. See Section 1.3 if you need some guidance.
3.2 Activity 2: Load in the libraries and read in the data
Today, we will be using tidyverse along with the two csv files created at the end of the last chapter: data_prp_for_ch3.csv and qrp_t1.csv. If you need to download them again for any reason, click on the following links: data_prp_for_ch3.csv and qrp_t1.csv.
If you need a quick reminder what the dataset was about, have a look at the abstract in Section 1.4. We also addressed the changes we made to the dataset there.
And remember to have a quick glimpse() at your data.
3.3 Activity 3: Confidence in understanding Open Science practices
The main goal is to compute the mean Understanding score per participant.
The mean Understanding score for time point 2 has already been calculated (in the Time2_Understanding_OS column), but we still need to compute it for time point 1.
Looking at the Understanding data at time point 1, you determine that
- individual item columns are , and
- according to the codebook, there are reverse-coded items in this questionnaire.
The steps are quite similar to those for QRP, but we need to add an extra step: converting the character labels into numbers.
Again, let’s do this step by step:
-
Step 1: Select the relevant columns
Code, and every Understanding column from time point 1 (e.g., fromUnderstanding_OS_1_Time1toUnderstanding_OS_12_Time1) and store them in an object calledunderstanding_t1 -
Step 2: Pivot the data from wide format to long format using
pivot_longer()so we can recode the labels into values (step 3) and calculate the average score (in step 4) more easily -
Step 3: Recode the values “Not at all confident” as 1 and “Entirely confident” as 7. All other values are already numbers. We can use functions
mutate()in combination withcase_match()for that -
Step 4: Calculate the average Understanding Open Science score (
Time1_Understanding_OS) per participant usinggroup_by()andsummarise()
Steps 1 and 2: Select and pivot
How about you try the first 2 steps yourself using the code from Chapter 2 Activity 4 (Section 2.4) as a template?
Step 3: recoding the values
OK, we now want to recode the values in the Responses column (or whatever name you picked for your column that has some of the numbers in it) so that “Not at all confident” = 1 and “Entirely confident” = 7. We want to keep all other values as they are (2-6 look already quite “numeric”).
Let’s create a new column Responses_corrected that stores the new values with mutate(). Then we can combine that with the case_match() function.
- The first argument in
case_match()is the column name of the variable you want to recode. - Then you can start recoding the values in the way of
CurrentValue ~ NewValue(~ is a tilde). Make sure you use the~and not=! - Lastly, the
.defaultargument tells R what to do with values that are neither “Not at all confident” nor “Entirely confident”. Here, we want to replace them with the original value of theResponsescolumn. In other datasets, you may want to set the default toNAfor missing values, a character string or a number, andcase_match()is happy to oblige.
understanding_t1 <- understanding_t1 %>%
  mutate(Responses_corrected = case_match(Responses, # column of the values to recode
                                          "Not at all confident" ~ 1, # values to recode
                                          "Entirely confident" ~ 7,
                                          .default = Responses # all other values taken from column Responses
  ))
Error in `mutate()`:
ℹ In argument: `Responses_corrected = case_match(...)`.
Caused by error in `case_match()`:
! Can't combine `..1 (right)` <double> and `.default` <character>.Have a look at the error message. It’s pretty helpful this time. It says Can't combine ..1 (right) <double> and .default <character>. It means that the replacement values are expected to be data type character since the original column type was type character.
So how do we fix this? Actually, there are several ways this could be done. Click on the tabs below to check out 3 possible solutions.
One option is to modify the .default argument Responses so that the values are copied over from the original column but as a number rather than the original character value. The function as.numeric() does the conversion.
understanding_t1_step3_v1 <- understanding_t1 %>%
  mutate(Responses_corrected = case_match(Responses, # column of the values to recode
                                          "Not at all confident" ~ 1, # values to recode
                                          "Entirely confident" ~ 7,
                                          .default = as.numeric(Responses) # all other values taken from column Responses but as numeric data type
  ))
Change the numeric values on the right side of the ~ to character. Then in a second step, we would need to turn the character column into a numeric type. Again, we have several options to do so. We could either use the parse_number() function we encountered earlier during the demographics wrangling or the as.numeric() function.
- V1:
Responses_corrected = parse_number(Responses_corrected) - V2:
Responses_corrected = as.numeric(Responses_corrected)
Just pay attention that you are still working within the mutate() function.
understanding_t1_step3_v2 <- understanding_t1 %>%
  mutate(Responses_corrected = case_match(Responses, # column of the values to recode
                                          "Not at all confident" ~ "1",
                                          "Entirely confident" ~ "7",
                                          .default = Responses # all other values taken from column Responses (character)
  ),
  Responses_corrected = parse_number(Responses_corrected)) # turning Responses_corrected into a numeric column
If you recode all the labels into numbers (e.g., “2” into 2, “3” into 3, etc.) from the start, you won’t need to perform any additional conversions later.
Of course, this could have been written up as a single pipe.
3.4 Activity 4: Survey of Attitudes Toward Statistics (SATS-28)
The main goal is to compute the mean SATS-28 score for each of the 4 subscales per participant for time point 1.
Looking at the SATS data at time point 1, you determine that
- individual item columns are , and
- according to the codebook, there are reverse-coded items in this questionnaire.
- Additionally, we are looking to compute the means for the 4 different subscales of the SAT-28 which are , , , and .
This scenario is slightly more tricky than the previous ones due to the reverse-coding and the 4 subscales. So, let’s tackle this step by step again:
-
Step 1: Select the relevant columns
Code, and every SATS28 column from time point 1 (e.g., fromSATS28_1_Affect_Time1toSATS28_28_Difficulty_Time1) and store them in an object calledsats_t1 -
Step 2: Pivot the data from wide format to long format using
pivot_longer()so we can recode the labels into values (step 3) and calculate the average score (in step 4) more easily -
Step 3: We need to know which items belong to which subscale - fortunately, we have that information in the variable name and can use the
separate()function to access it. -
Step 4: We need to know which items are reverse-coded and then reverse-score them - unfortunately, the info is only in the codebook and we need to find a work-around.
case_when()can help identify and re-score the reverse-coded items. -
Step 5: Calculate the average SATS score per participant and subscale using
group_by()andsummarise() -
Step 6: use
pivot_wider()to spread out the dataframe into wide format andrename()to tidy up the column names
Steps 1 and 2: select and pivot
The selecting and pivoting are exactly the same way as we already practiced in the other 2 questionnaires. Apply them here to this questionnaire.
Step 3: separate Subscale information
If you look at the Items column more closely, you can see that there is information on the Questionnaire, the Item_number, the Subscale, and the Timepoint the data was collected at.
We can separate the information into separate columns using the separate() function. The function’s first argument is the column to separate, then define into which columns you want the original column to split up, and lastly, define the separator sep (here an underscore). For our example, we would write:
- V1:
separate(Items, into = c("SATS", "Item_number", "Subscale", "Time"), sep = "_")
However, we don’t need all of those columns, so we could just drop the ones we are not interested in by replacing them with NA.
- V2:
separate(Items, into = c(NA, "Item_number", "Subscale", NA), sep = "_")
We might also add an extra argument of convert = TRUE to have numeric columns (i.e., Item_number) converted to numeric as opposed to keeping them as characters. Saves us typing a few quotation marks later in Step 4.
Step 4: identifying reverse-coded items and then correct them
We can use case_when() within the mutate() function here to create a new column FW_RV that stores information on whether the item is a reverse-coded item or not.
case_when() works similarly to case_match(), however case_match() only allows us to “recode” values (i.e., replace one value with another), whereas case_when() is more flexible. It allows us to use conditional statements on the left side of the tilde which is useful when you want to change only some of the data based on specific conditions.
Looking at the codebook, it seems that items 2, 3, 4, 6, 7, 8, 9, 12, 13, 16, 17, 19, 20, 21, 23, 25, 26, 27, and 28 are reverse-coded. The rest are forward-coded.
We want to tell R now, that
-
if the
Item_numberis any of those numbers listed above, R should write “Reverse” into the new columnFW_RVwe are creating. Since we have a few possible matches forItem_number, we need the Boolean expression%in%rather than==. -
if
Item_numberis none of those numbers, then we would like the word “Forward” in theFW_RVcolumn to appear. We can achieve that by specifying a.defaultargument again, but this time we want a “word” rather than a value from another column.
Moving on to correcting the scores: Once again, we can use case_when () within the mutate() function to create another conditional statement. This time, the condition is:
-
if
FW_RVcolumn has a value of “Reverse” then we would like to turn all 1 into 7, 2 into 6, etc. -
if
FW_RVcolumn has a value of “Forward” then we would like to keep the score from theResponsecolumn
There is a quick way and a not-so-quick way to achieve the actual reverse-coding.
- Option 1 (quick): The easiest way to reverse-code scores is to take the maximum value of the scale, add 1 unit, and subtract the original value. For example, on a 5-point Likert scale, it would be 6 minus the original rating; for a 7-point Likert scale, 8 minus the original rating, etc. (see Option 1 tab).
- Option 2 (not so quick): This involves using two conditional statements (see Option 2 tab).
Use the one you find more intuitive.
Here we are using a Boolean expression to check if the string “Reverse” is present in the FW_RV column. If this condition is TRUE, the value in the new column we’re creating, Scores_corrected, will be calculated as 8 minus the value from the Response column. If the condition is FALSE (handled by the .default argument), the original values from the Response column will be retained.
As stated above, the longer approach involves using two conditional statements. The first condition checks if the value in the FW_RV column is “Reverse”, while the second condition checks if the value in the Response column equals a specific number. When both conditions are met, the corresponding value on the right side of the tilde is placed in the newly created Scores_corrected_v2 column.
For example, line 3 would read: if the value in the FW_RV column is “Reverse” AND the value in the Response column is 1, then assign a value of 7 to the Scores_corrected_v2 column.
sats_t1 <- sats_t1 %>%
  mutate(Scores_corrected_v2 = case_when(
    FW_RV == "Reverse" & Response == 1 ~ 7,
    FW_RV == "Reverse" & Response == 2 ~ 6,
    FW_RV == "Reverse" & Response == 3 ~ 5,
    # no need to recode 4 as 4
    FW_RV == "Reverse" & Response == 5 ~ 3,
    FW_RV == "Reverse" & Response == 6 ~ 2,
    FW_RV == "Reverse" & Response == 7 ~ 1,
    .default = Response
  ))
As you can see now in sats_t1, both columns Scores_corrected and Scores_corrected_v2 are identical.
One way to check whether our reverse-coding worked is by examining the distinct values in the original Response column and comparing them with the Scores_corrected. We should also retain the FW_RV column to observe how the reverse-coding applied.
To see the patterns more clearly, we can use arrange() to sort the values in a meaningful order. Remember, the default sorting order is ascending, so if you want to sort values in descending order, you’ll need to wrap your variable in the desc() function.
Step 5
Now that we know everything worked out as intended, we can calculate the mean scores of each subscale for each participant in sats_t1.
Step 6
The final step is to transform the data back into wide format, ensuring that each subscale has its own column. This will make it easier to join the data objects later on. In pivot_wider(), the first argument, names_from, specifies the column you want to use for your new column headings. The second argument, values_from, tells R which column should provide the cell values.
We should also rename the column names to match those in the codebook. Conveniently, we can use a function called rename() that works exactly like select() (following the pattern new_name = old_name), but it keeps all other column names the same rather than reducing the number of columns.
Again, this could have been written up as a single pipe.
3.5 Activity 5 (Error Mode): Perceptions of supervisory support
The main goal is to compute the mean score for perceived supervisory support per participant.
Looking at the supervisory support data, you determine that
- individual item columns are , and
- according to the codebook, there are reverse-coded items in this questionnaire.
I have outlined my steps as follows:
-
Step 1: Reverse-code the single column first because that’s less hassle than having to do that with conditional statements (
Supervisor_15_R).mutate()is my friend. -
Step 2: I want to filter out everyone who failed the attention check in
Supervisor_7. I can do this with a Boolean expression within thefilter()function. The correct response was “completely disagree” which is 1. -
Step 3: Select their id from time point 2 and all the columns that start with the word “super”, apart from
Supervisor_7and the originalSupervisor_15_Rcolumn - Step 4: pivot into long format so I can calculate the averages better
- Step 5: calculate the average scores per participant
I’ve started coding but there are some errors in my code. Help me find and fix all of them. Try to go through the code line by line and read the error messages.
super <- data_ppr %>%
  mutate(Supervisor_15 = 9-supervisor_15_R) %>%
  filter(Supervisor_7 = 1) %>%
  select(Code, starts_with("Super"), -Supervisor_7, -Supervisor_15_R)
pivot_wider(cols = -Code, names_to = "Item", values_to = "Response") %>%
  group_by(Time2_Code) %>%
  summarise(Mean_Supervisor_Support = mean(Score_corrected, na.rm = TRUE)) %>%
  ungroup()
3.6 Activity 6: Join everything together with ???_join()
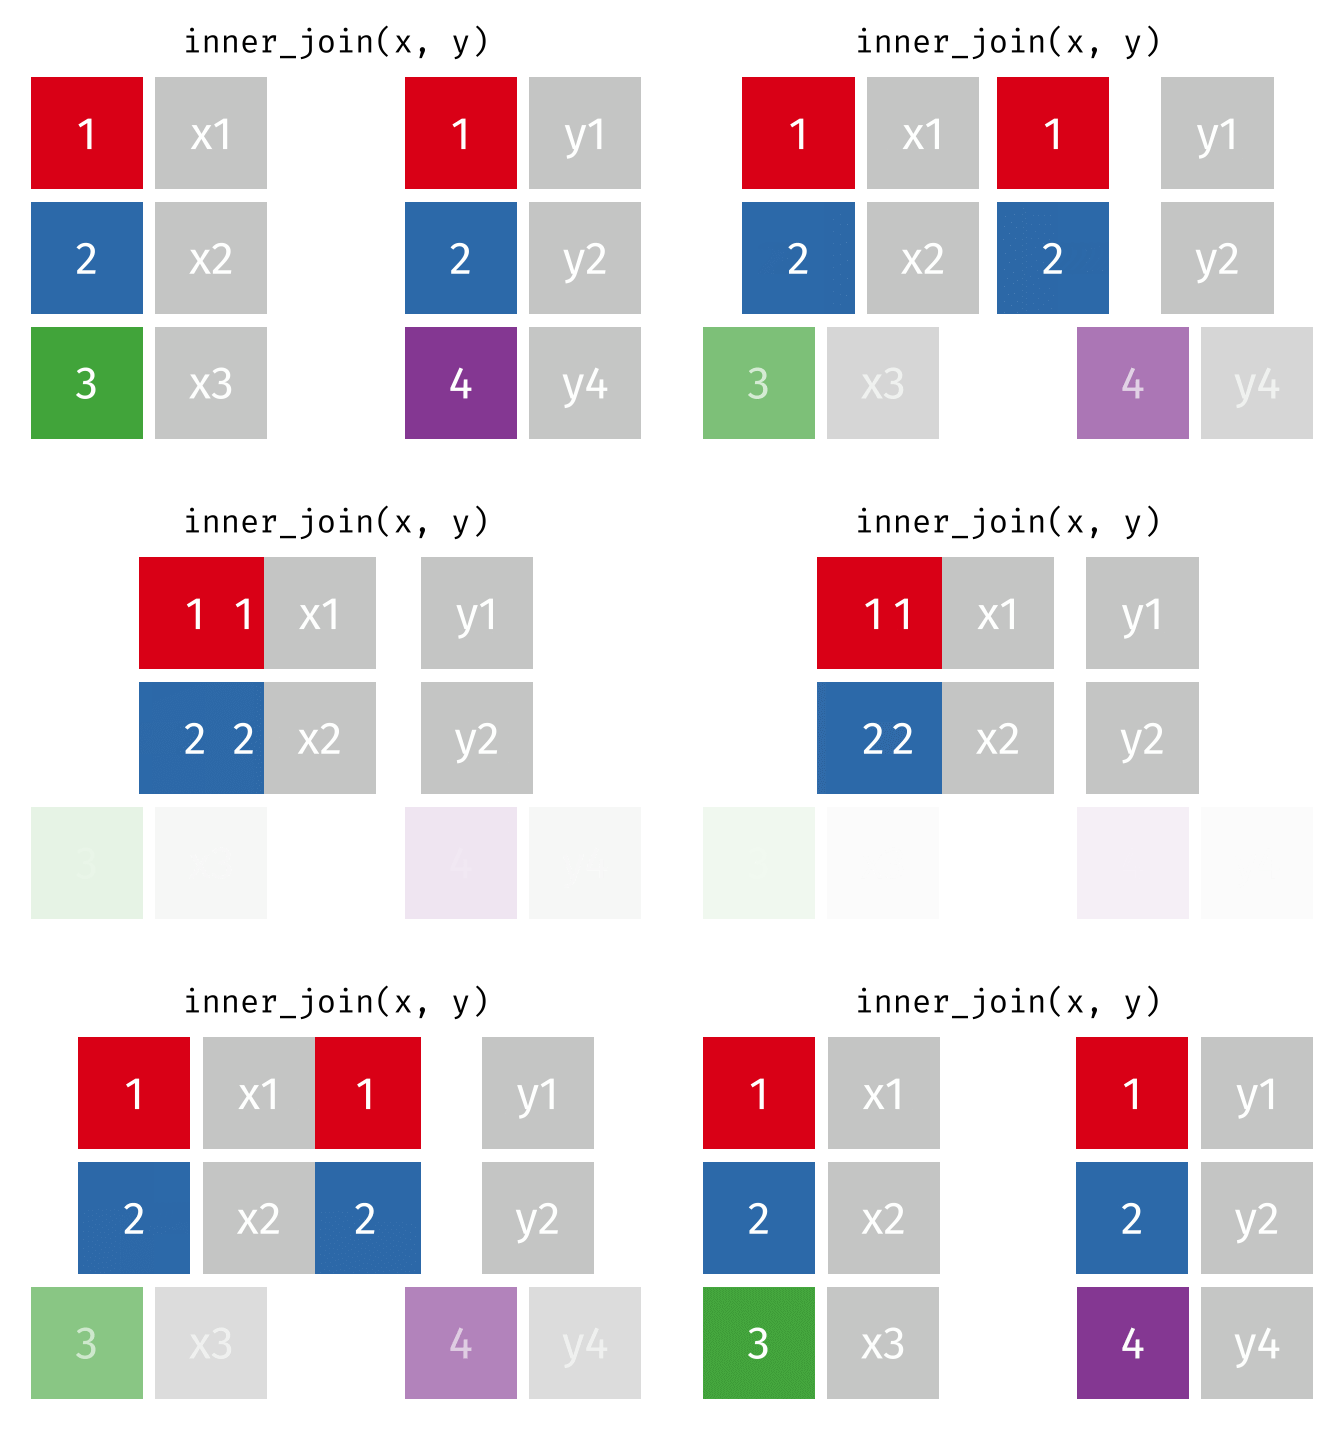
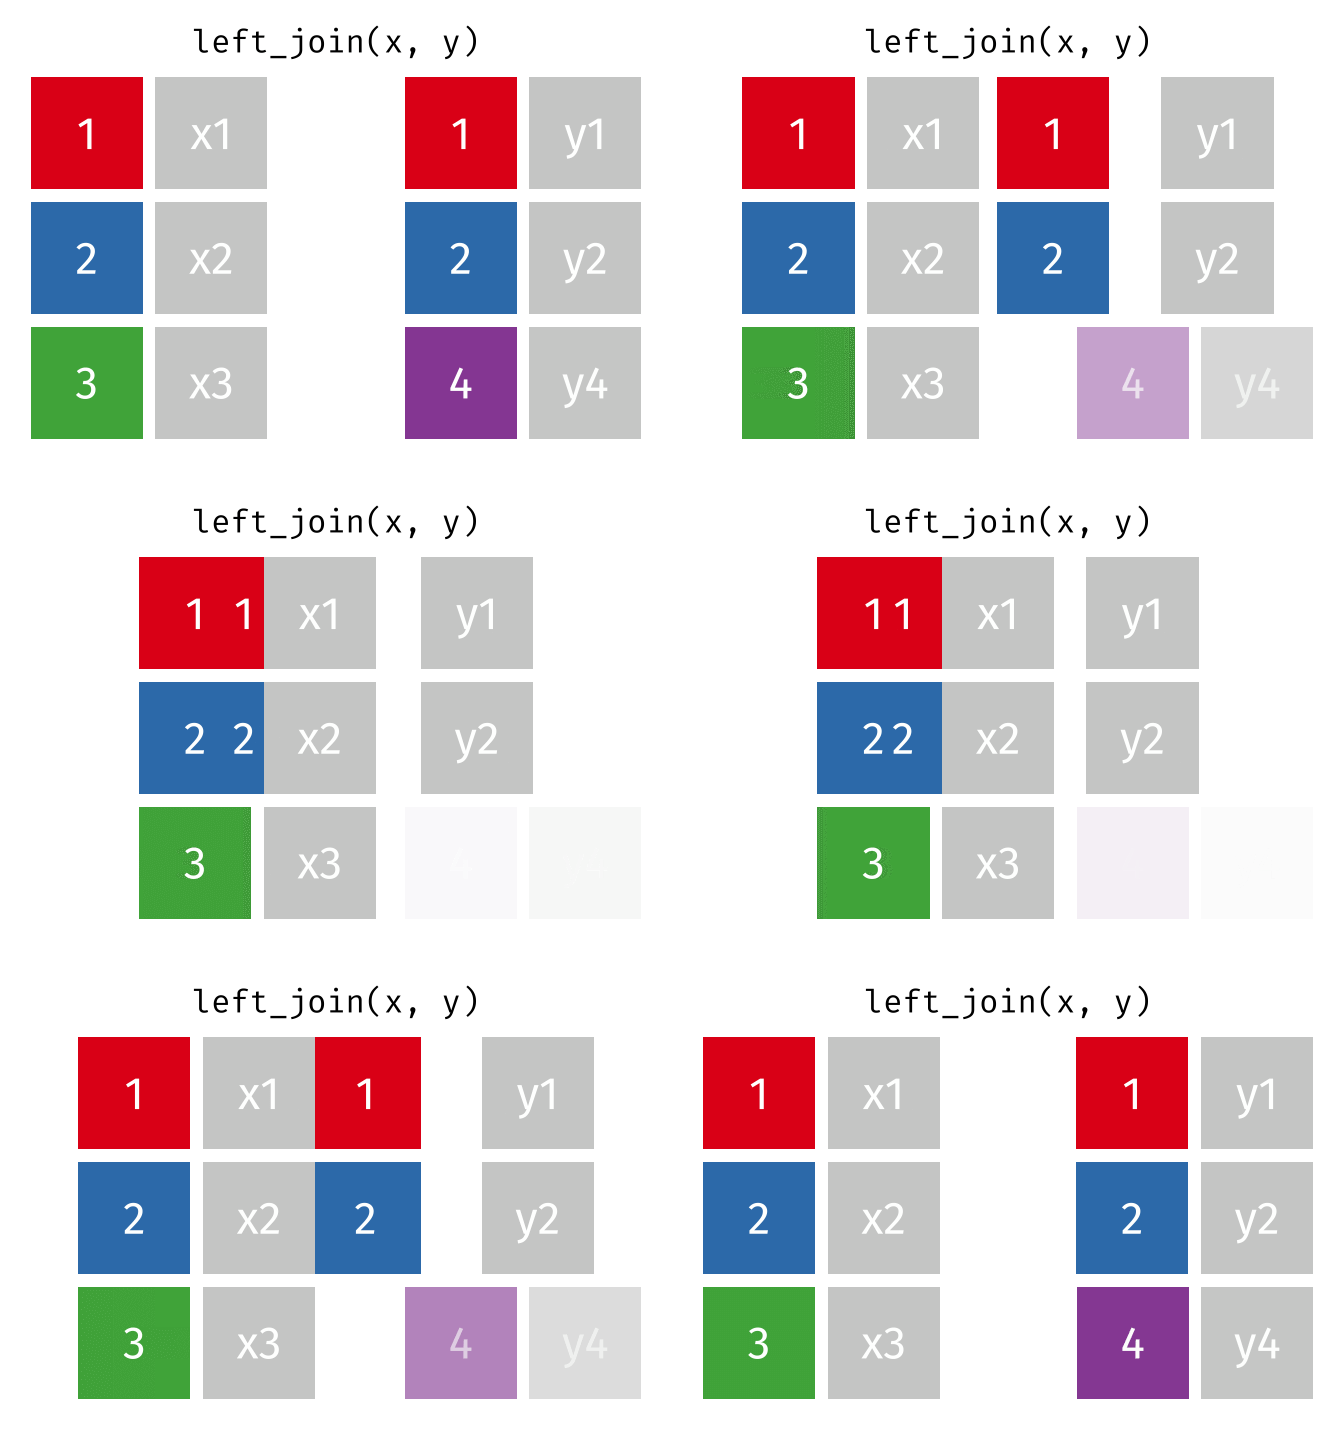
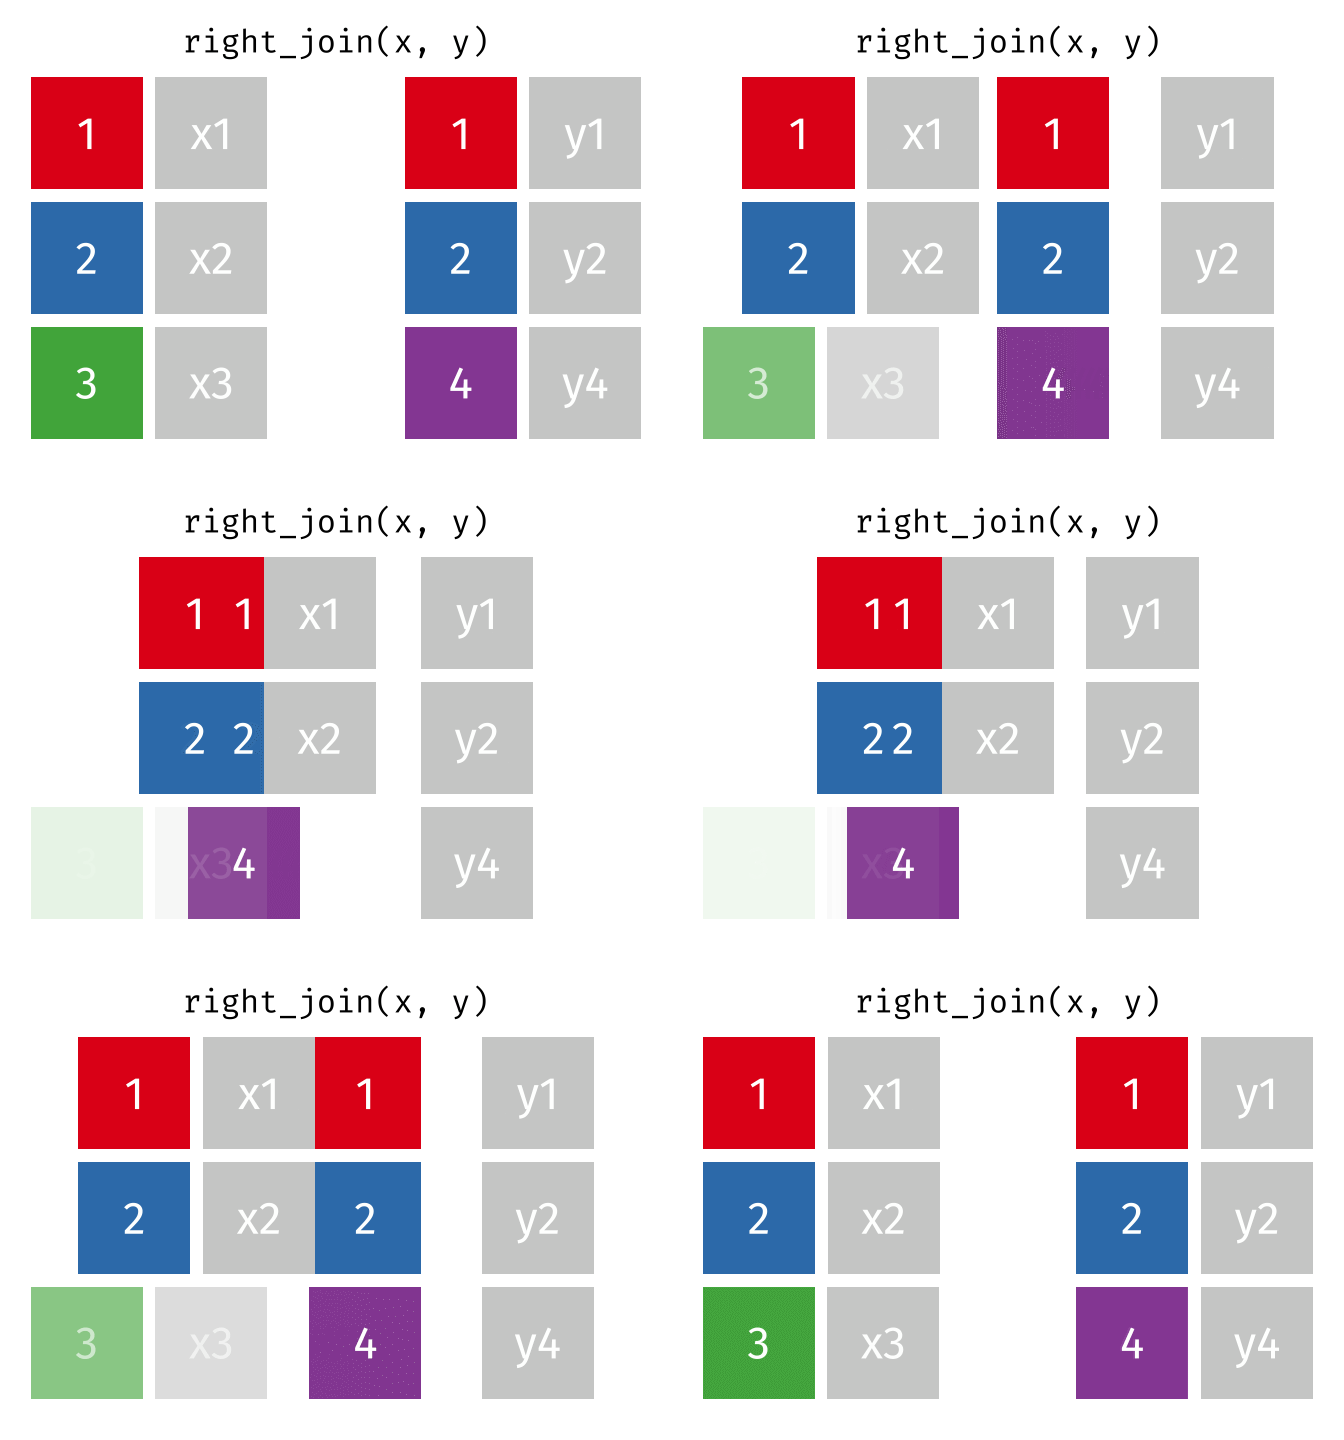
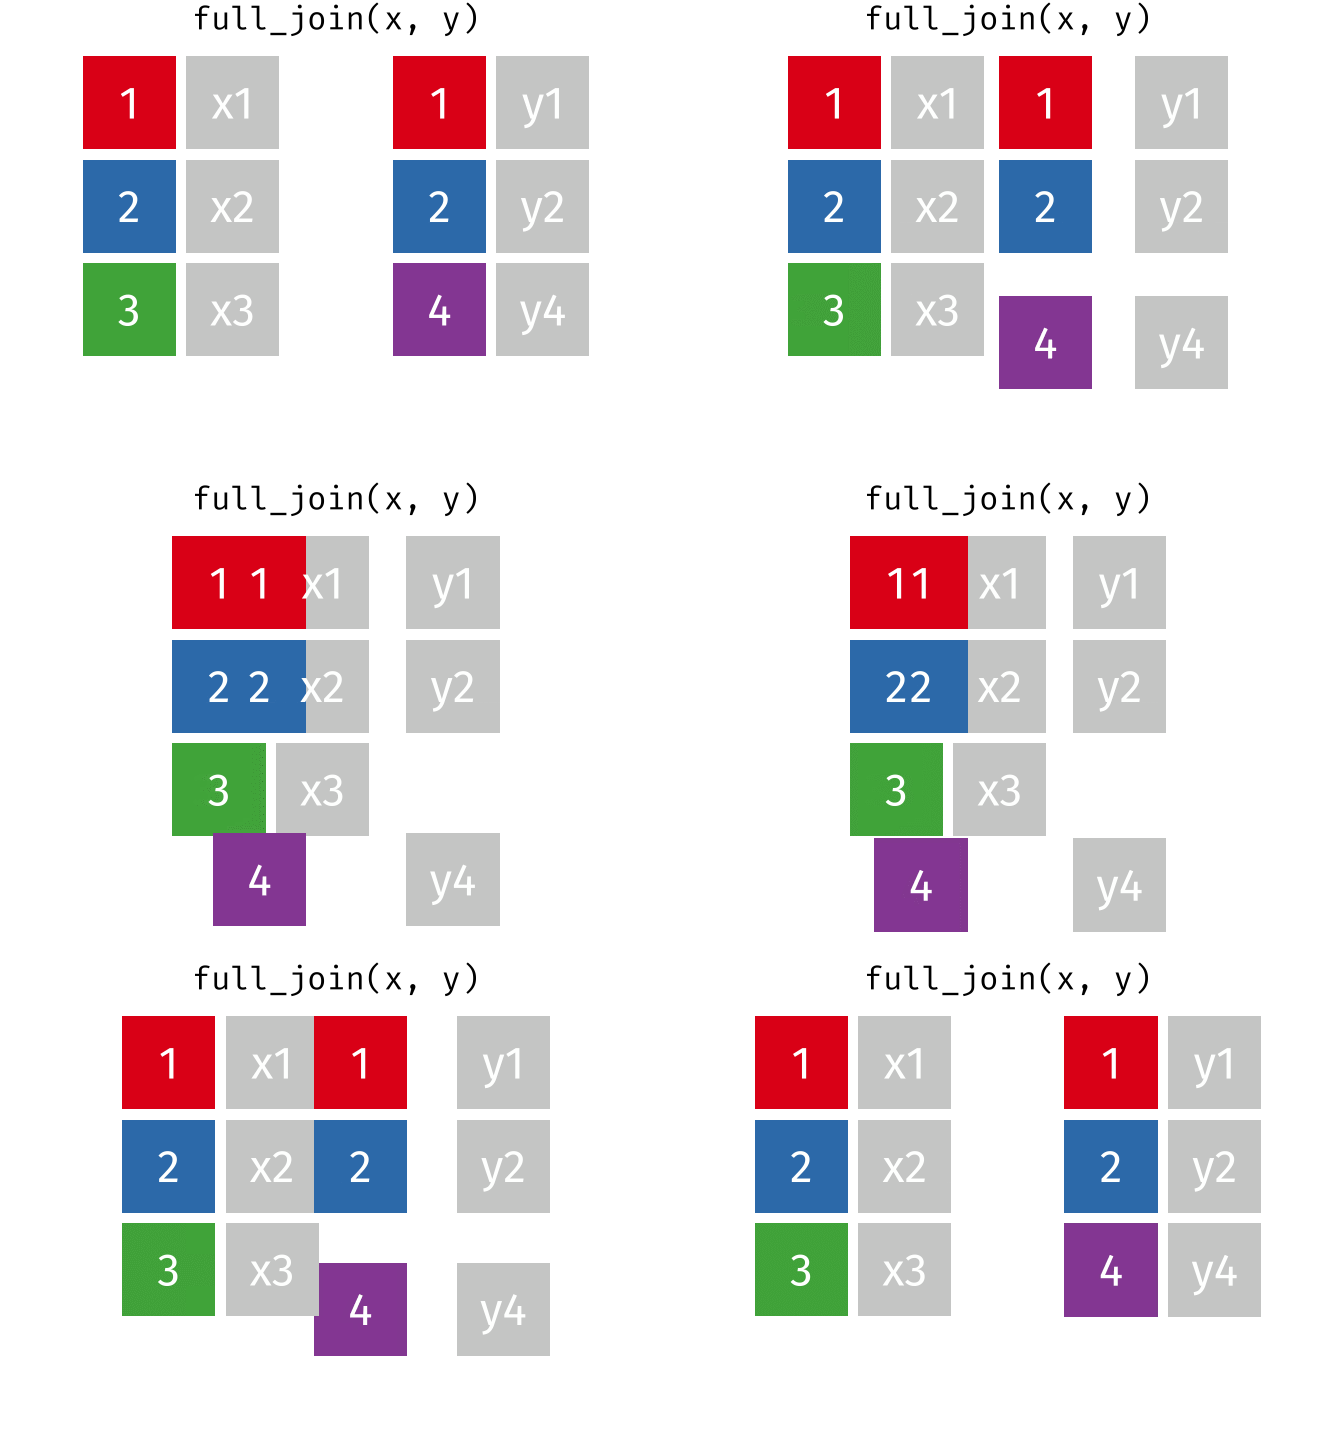
Time to join all the relevant data files into a single dataframe, which will be used in the next chapters on data visualization. There are four ways to join data: inner_join(), left_join(), right_join(), and full_join(). Each function behaves differently in terms of what information is retained from the two data objects. Here is a quick overview:
From our original data_prp, we need to select demographics data and all summarised questionnaire data from time point 2. Next, we will join this with all other aggregated datasets from time point 1 which are currently stored in separate data objects in the Global Environment.
While you may be familiar with inner_join() from last year, for this task, we want to retain all data from all the data objects. Therefore, we will use full_join(). Keep in mind, you can only join two data objects at a time, so the upcoming code chunk will involve a fair bit of piping and joining.
Note: Since I (Gaby) like my columns arranged in a meaningful way, I will use select() at the end to order them better.
data_prp_final <- data_prp %>%
  select(Code:Plan_prereg, Pre_reg_group:Time2_Understanding_OS) %>%
  full_join(qrp_t1) %>%
  full_join(understanding_t1) %>%
  full_join(sats_t1) %>%
  full_join(super) %>%
select(Code:Plan_prereg, Pre_reg_group, SATS28_Affect_Time1_mean, SATS28_CognitiveCompetence_Time1_mean, SATS28_Value_Time1_mean, SATS28_Difficulty_Time1_mean, QRPs_Acceptance_Time1_mean, Time1_Understanding_OS, Other_OS_behav_2:Time2_Understanding_OS, Mean_Supervisor_Support)And this is basically the dataset we need for Chapter 4 and Chapter 5.
3.7 Activity 7: Knit and export
Knit the .Rmd file to ensure everything runs as expected. Once it does, export the data object data_prp_final as a csv for use in the Chapter 4. Name it something meaningful, something like data_prp_for_ch4.csv.
Pair-coding
We will once again be working with data from Binfet et al. (2021), which focuses on the randomised controlled trials data involving therapy dog interventions. Today, our goal is to calculate the average Loneliness score for each participant measured at time point 1 (pre-intervention) using the raw data file dog_data_raw. Currently, the data looks like this:
| RID | L1_1 | L1_2 | L1_3 | L1_4 | L1_5 | L1_6 | L1_7 | L1_8 | L1_9 | L1_10 | L1_11 | L1_12 | L1_13 | L1_14 | L1_15 | L1_16 | L1_17 | L1_18 | L1_19 | L1_20 |
|---|---|---|---|---|---|---|---|---|---|---|---|---|---|---|---|---|---|---|---|---|
| 1 | 3 | 3 | 4 | 3 | 2 | 3 | 1 | 2 | 3 | 4 | 3 | 1 | 3 | 1 | 2 | 3 | 2 | 3 | 2 | 4 |
| 2 | 3 | 2 | 3 | 3 | 4 | 3 | 2 | 2 | 4 | 3 | 2 | 2 | 1 | 2 | 4 | 3 | 3 | 2 | 4 | 3 |
| 3 | 3 | 3 | 2 | 3 | 3 | 4 | 2 | 3 | 3 | 3 | 2 | 2 | 2 | 2 | 3 | 3 | 4 | 3 | 3 | 3 |
| 4 | 4 | 2 | 2 | 3 | 4 | 4 | 1 | 3 | 3 | 4 | 2 | 1 | 2 | 2 | 4 | 4 | 3 | 3 | 4 | 3 |
| 5 | 2 | 3 | 3 | 3 | 4 | 3 | 2 | 2 | 3 | 2 | 4 | 4 | 4 | 3 | 2 | 2 | 3 | 4 | 3 | 2 |
But we want the data to look like this:
| RID | Loneliness_pre |
|---|---|
| 1 | 2.25 |
| 2 | 1.90 |
| 3 | 2.25 |
| 4 | 1.75 |
| 5 | 2.85 |
This task is a bit more challenging compared to last week’s lab activity, as the Loneliness scale includes some reverse-coded items.
Task 1: Open the R project for the lab
Task 2: Open your .Rmd file from last week or create a new .Rmd file
You could continue the .Rmd file you used last week, or create a new .Rmd. If you need some guidance, have a look at Section 1.3.
Task 3: Load in the library and read in the data
The data should already be in your project folder. If you want a fresh copy, you can download the data again here: data_pair_coding.
We are using the package tidyverse today, and the datafile we should read in is dog_data_raw.csv.
Task 4: Calculating the mean for Loneliness_pre
-
Step 1: Select all relevant columns, such as the participant ID and all 20 items of the
Lonelinessquestionnaire completed by participants before the intervention. Store this data in an object calleddata_loneliness.
- Step 2: Pivot the data from wide format to long format so we can reverse-score and calculate the average score more easily (in step 3)
- Step 3: Reverse-scoring
Identify the items on the Loneliness scale that are reverse-coded, and then reverse-score them accordingly.
-
Step 4: Calculate the average Loneliness score per participant. To match with the table above, we want to call this column
Loneliness_pre
Test your knowledge and challenge yourself
Knowledge check
Question 1
When using mutate(), which additional function could you use to recode an existing variable?
Question 2
When using mutate(), which additional function could you use to create a new variable based on one or multiple conditional statements?
Question 3
Which of the following functions would you use if you wanted to join two data sets by their shared identifier?
Question 4
Your data object contains a column Score with numbers, but they have been read in incorrectly as a character datatype. Which of the following functions would not work for fixing this issue?
Challenge yourself
If you want to challenge yourself and further apply the skills from Chapter 3, you could wrangle the data from dog_data_raw for one of the other questionnaires. There are plenty of options to choose from:


