15 Bayesian Mixed Effects Models
In the recordings, James walked through the building blocks of fitting and interpreting mixed effects models, first from a frequentist perspective and then from a Bayesian perspective. The data come from Brown (2021) who developed a tutorial for mixed effects models. Part 1 here uses the
Make sure you have the following packages installed and loaded.
Now we have our packages, we need to read the data from Brown (2021) who report a repeated measures study on speech perception. Participants complete two tasks where they listen to words being spoken while they complete a response time task. The words are presented in two conditions: 1) just being spoken in an auditory condition and 2) being spoken and seeing the speaker in an audiovisual condition. Each participant completes the task for 543 words, split between the two conditions in a different order for each participant. They expected response times to be slower in the audiovisual condition compared to the audio condition due to the interference from listening.
This means we have a repeated measures / within-subjects design. The outcome is response time in milliseconds (ms). The predictor - or fixed effect - is the modality (audio and audiovisual). We will also explore the impact of participants and the word stimuli as random effects.
15.1 Bayesian
Now we have fitted the models using
As an initial warning, these models are going to take 15-30 minutes to run on your computer. I have provided the model objects for you to work with quickly, but they are quite computationally expensive to run yourself. This is also why I have focused on the random intercept only model, purely for pragmatic reasons. It takes up to an hour to fit a random intercept and slope model for these data. The formula structure is identical though, so are you are welcome to try and fit the “maximal” model yourself.
15.1.1 Default priors
We will start by fitting a model with default priors to explore the main difference in using
We can pass that to the brm() function without specifying priors to update to our posterior probability distributions. You can download the model objects to speed things up, or it will save the model objects to your computer in a “Models” sub-folder if you do not have it saved.
 Family: gaussian
  Links: mu = identity; sigma = identity
Formula: RT ~ modality + (1 | PID) + (1 | stim)
   Data: brown_data (Number of observations: 21679)
  Draws: 4 chains, each with iter = 2000; warmup = 1000; thin = 1;
         total post-warmup draws = 4000

Group-Level Effects:
~PID (Number of levels: 53)
              Estimate Est.Error l-95% CI u-95% CI Rhat Bulk_ESS Tail_ESS
sd(Intercept)   169.56     16.59   141.56   205.40 1.00      634     1322

~stim (Number of levels: 543)
              Estimate Est.Error l-95% CI u-95% CI Rhat Bulk_ESS Tail_ESS
sd(Intercept)    18.22      3.72     9.25    24.62 1.00      942      670

Population-Level Effects:
                    Estimate Est.Error l-95% CI u-95% CI Rhat Bulk_ESS Tail_ESS
Intercept            1040.69     22.97   996.04  1087.17 1.01      263      604
modalityAudiovisual    82.52      3.57    75.46    89.66 1.00    10771     2504

Family Specific Parameters:
      Estimate Est.Error l-95% CI u-95% CI Rhat Bulk_ESS Tail_ESS
sigma   259.30      1.25   256.86   261.75 1.00     6120     2854

Draws were sampled using sampling(NUTS). For each parameter, Bulk_ESS
and Tail_ESS are effective sample size measures, and Rhat is the potential
scale reduction factor on split chains (at convergence, Rhat = 1).
The organisation of
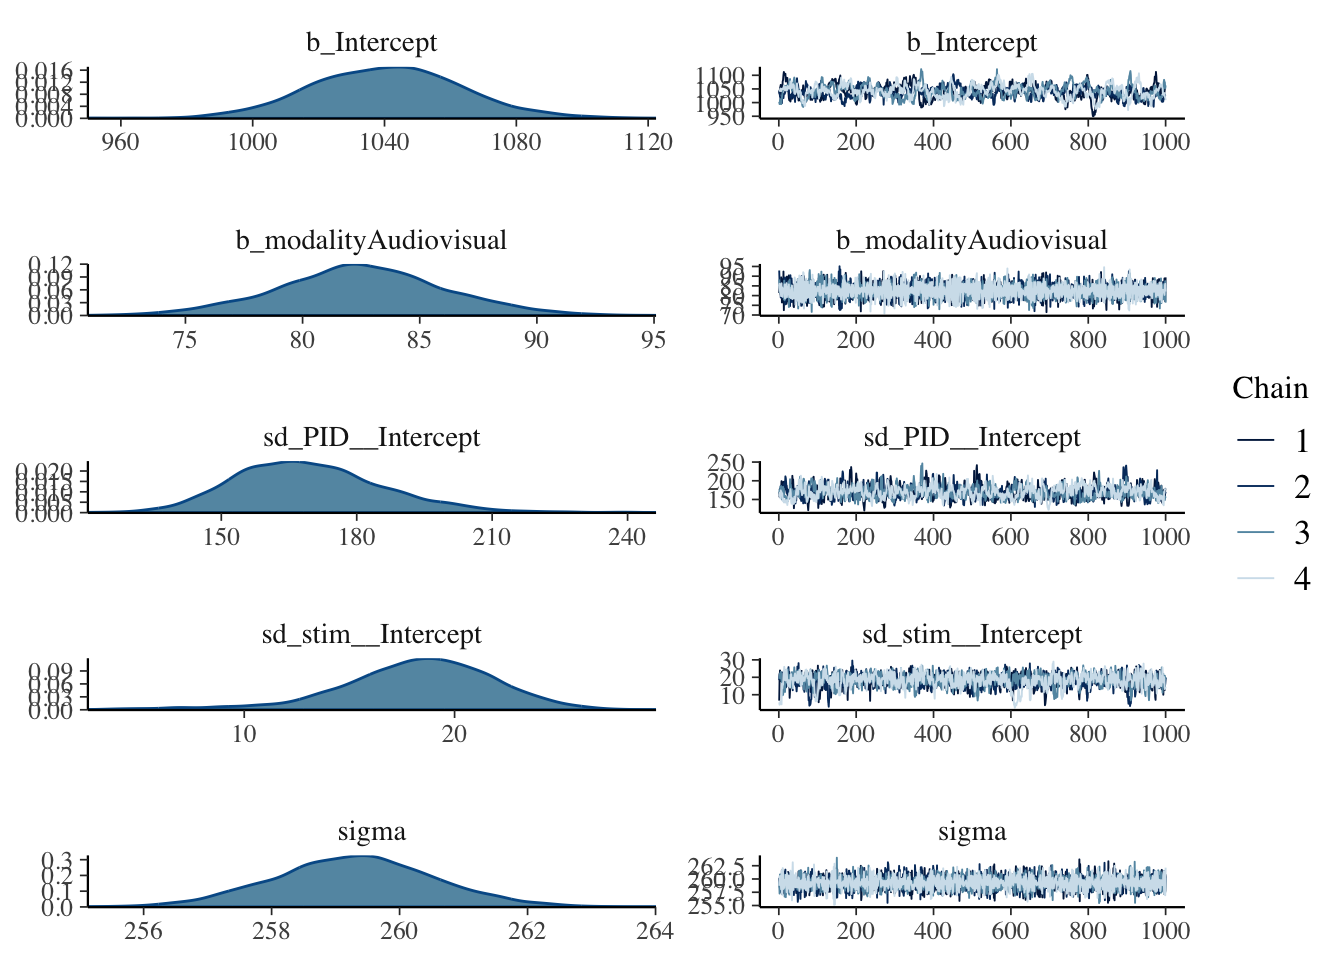
Our estimates are similar to the frequentist equivalents but there are some potential problems we have not encountered in previous Bayesian models, given we are now working with more complex models. The R-hat values are all good but several effect sample size values are far too small in the low hundreds.
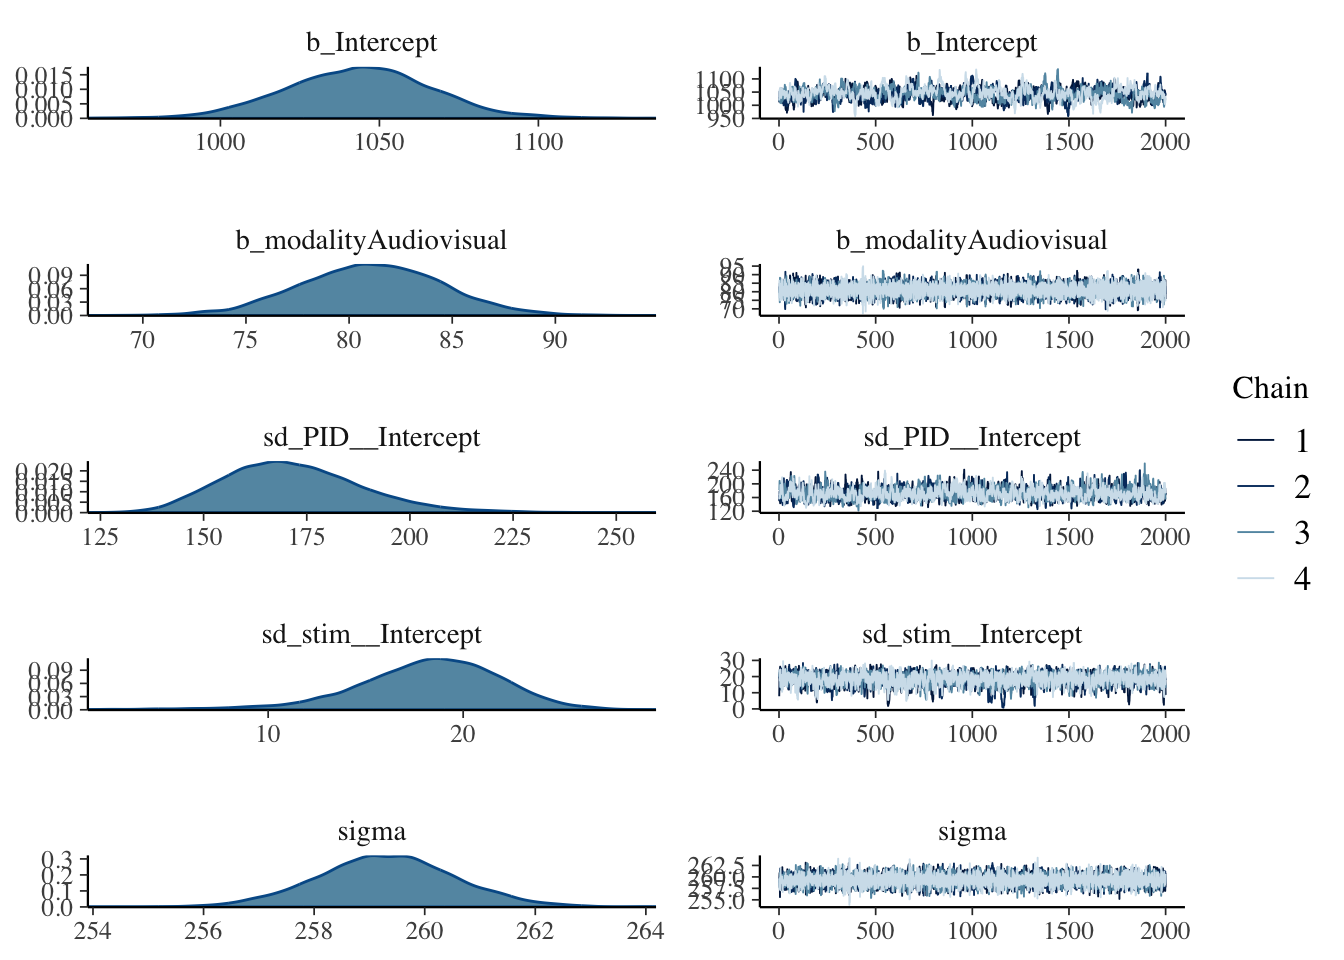
We will not explore everything for this default prior model, but we can explore the posteriors and trace plots. The intercept seems to be the most problematic following the low effective sample size values, with the plot here looking particularly choppy.
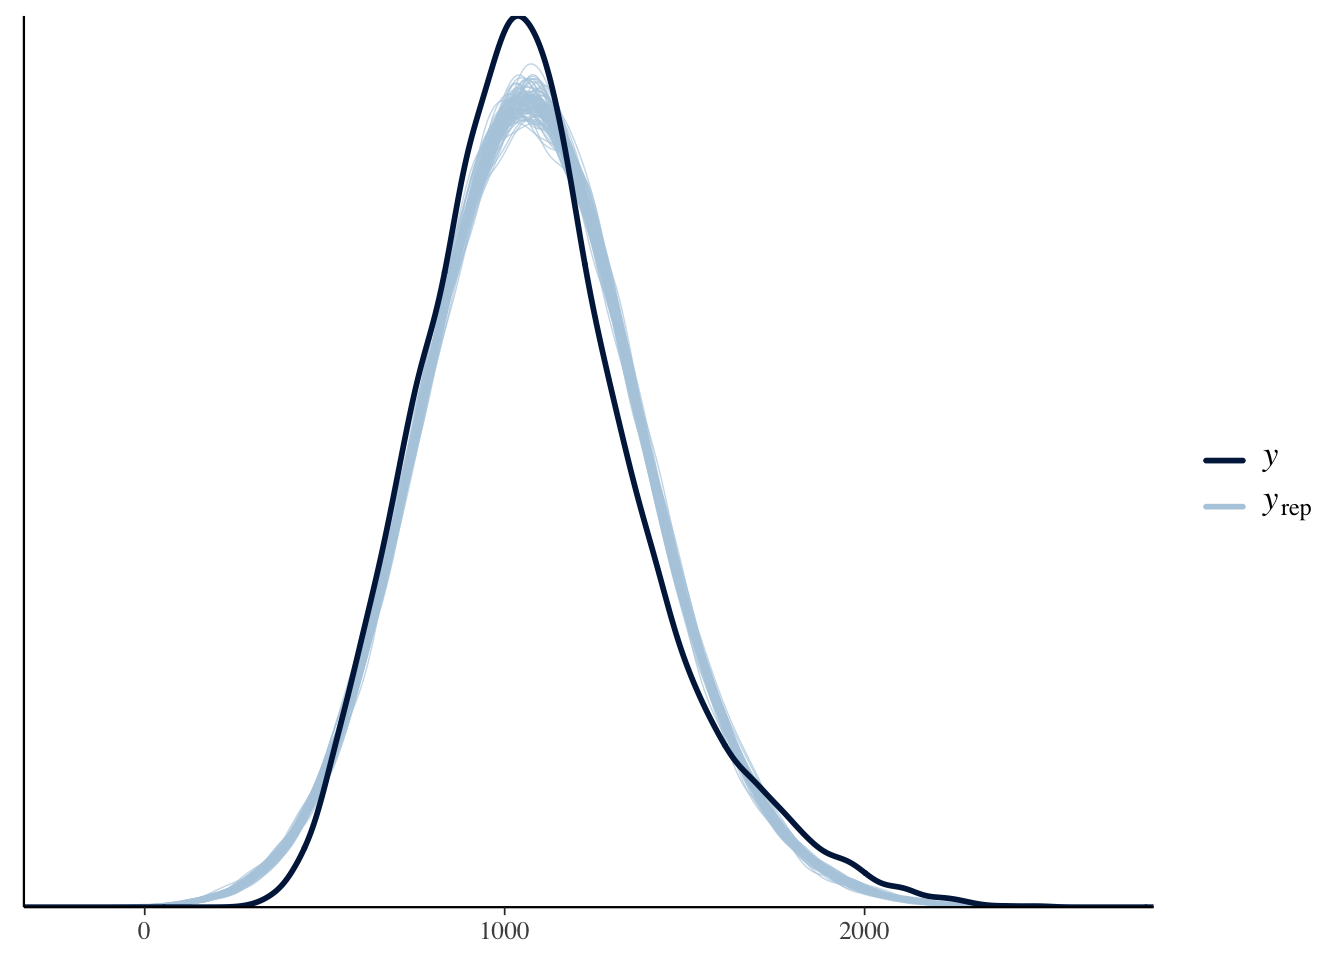
The final thing we will look at here is the posterior predictive check to make sure assuming normality is a reasonable choice.
Brown (2021) notes in the tutorial that the response time data have been edited to be more suitable for teaching contexts. Presumably this is making them look a little more normal or the responses are just much slower here, as a normal distribution suits the data quite well. Normally, they have characteristic skew where you need to consider something like a gamma distribution.
15.1.2 Informed priors
The model we will explore in a little more detail is setting informed priors for the parameters we can set reasonable expectations on. Using our descriptive model and data, we can see what
| prior | class | coef | group | resp | dpar | nlpar | lb | ub | source |
|---|---|---|---|---|---|---|---|---|---|
| b | default | ||||||||
| b | modalityAudiovisual | default | |||||||
| student_t(3, 1057, 289.1) | Intercept | default | |||||||
| student_t(3, 0, 289.1) | sd | 0 | default | ||||||
| sd | PID | default | |||||||
| sd | Intercept | PID | default | ||||||
| sd | stim | default | |||||||
| sd | Intercept | stim | default | ||||||
| student_t(3, 0, 289.1) | sigma | 0 | default |
In a mixed effects model, we have more parameters than we have set so far. We have our standard intercept, slope, and sigma. We also have standard deviation parameters for our two random effects. It looks busier than it really is as
For our model, we can use Brown and Strand (2019), a previous article from the tutorial author where they reported a similar study. It is very rare to see people reporting values for sigma or standard deviations, so we are just going to focus on setting priors for the intercept and slope. We do not have enough subject knowledge to set the other priors.
In Brown and Strand (2019), they report descriptive statistics for the mean response time to audio stimuli between 998ms and 1089ms, with an SD between 161 and 203. We can use this information to set a prior for the intercept. There are other predictors in the models they fit, but modality ranged between 21ms and 48ms slower for audiovisual stimuli. The larger effects were statistically significant and the smaller effects were non-significant, so we can bake in a wide range of uncertainty to expect positive values for the slope, but include some negative values for the non-signicant effects.
brown_priors <- set_prior("normal(35, 20)", class = "b") +
  set_prior("normal(1040, 180)", class = "Intercept")

brown_priors %>%
  parse_dist() %>% # Function from tidybayes/ggdist to turn prior into a dataframe
  mutate(prior_label = paste0(class, ": ", prior)) %>% # add the class and prior
  ggplot(aes(y = 0, dist = .dist, args = .args, fill = prior_label)) + # Fill in details from prior and add fill
  stat_slab(normalize = "panels") + # ggdist layer to visualise distributions
  scale_fill_viridis_d(option = "plasma", end = 0.9) + # Add colour scheme
  guides(fill = "none") + # Remove legend for fill
  facet_wrap(~prior_label, scales = "free") + # Split into a different panel for each prior
  labs(x = "Value", y = "Density") +
  theme_classic()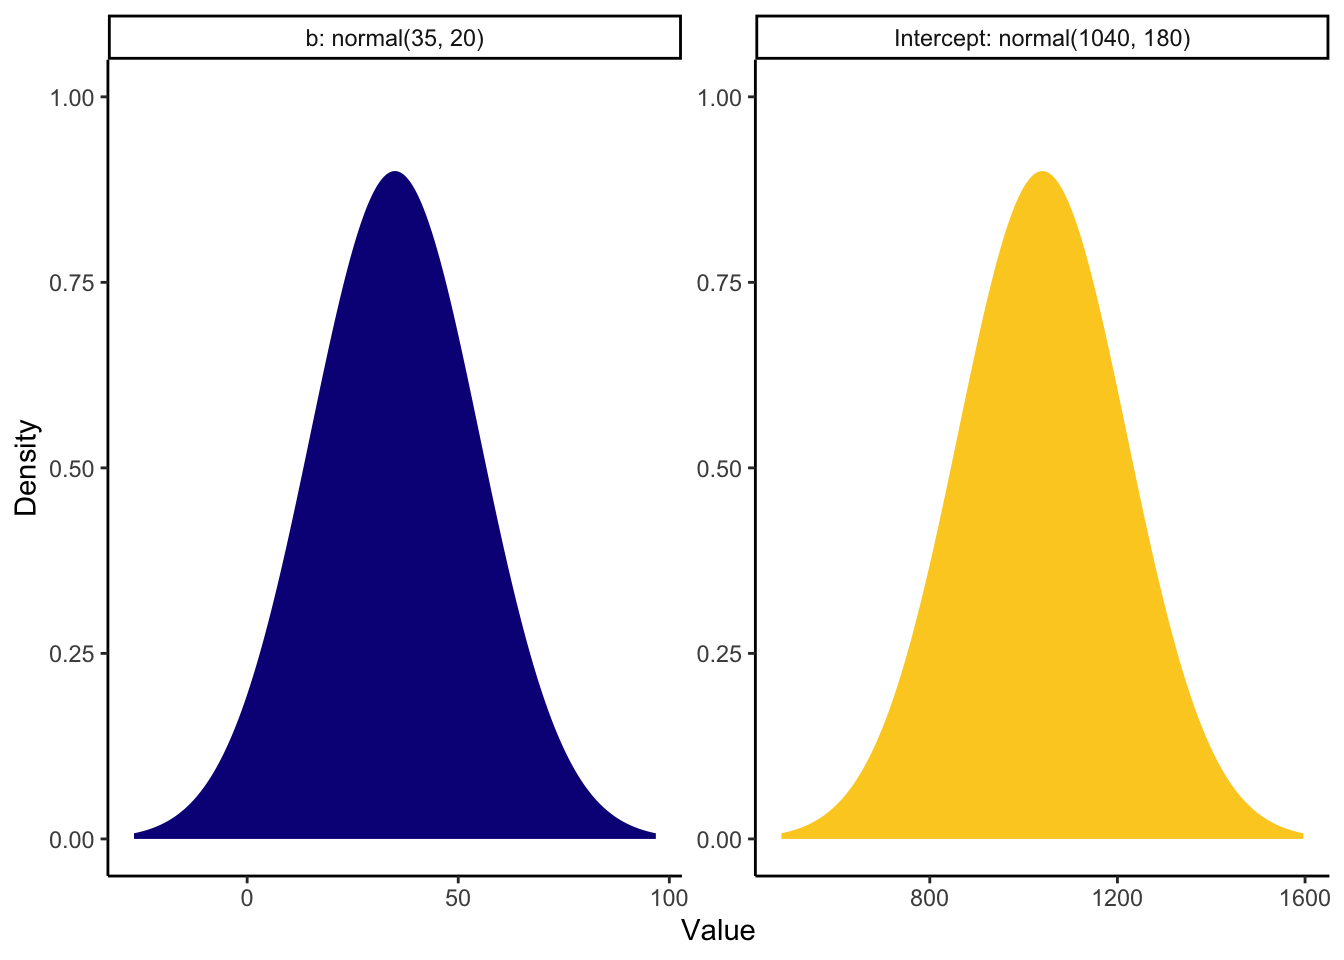
Now we have our priors, we can refit the model. Given the effect sample size values, I also increased the number of iterations. This will produce 8000 post-warmup draws instead of 4000 to try and increase the effective sample size.
 Family: gaussian
  Links: mu = identity; sigma = identity
Formula: RT ~ modality + (1 | PID) + (1 | stim)
   Data: brown_data (Number of observations: 21679)
  Draws: 4 chains, each with iter = 4000; warmup = 2000; thin = 1;
         total post-warmup draws = 8000

Group-Level Effects:
~PID (Number of levels: 53)
              Estimate Est.Error l-95% CI u-95% CI Rhat Bulk_ESS Tail_ESS
sd(Intercept)   171.76     16.76   143.16   208.65 1.00     1173     2384

~stim (Number of levels: 543)
              Estimate Est.Error l-95% CI u-95% CI Rhat Bulk_ESS Tail_ESS
sd(Intercept)    18.22      3.77     9.57    24.70 1.00     1713     1266

Population-Level Effects:
                    Estimate Est.Error l-95% CI u-95% CI Rhat Bulk_ESS Tail_ESS
Intercept            1043.64     23.27   998.27  1089.81 1.01      387      928
modalityAudiovisual    81.08      3.45    74.28    87.85 1.00    21349     5464

Family Specific Parameters:
      Estimate Est.Error l-95% CI u-95% CI Rhat Bulk_ESS Tail_ESS
sigma   259.32      1.25   256.87   261.79 1.00    16344     5110

Draws were sampled using sampling(NUTS). For each parameter, Bulk_ESS
and Tail_ESS are effective sample size measures, and Rhat is the potential
scale reduction factor on split chains (at convergence, Rhat = 1).
Setting priors and increasing the number of iterations has helped the model, but it is still quite ideal. Really, you would want to keep on tweaking the model until the effect sample size was in the high hundreds for the intercept, but it is improved for all the other parameters. Low effective sample size points to potentially unreliable parameter estimates but we will explore this one in the interests of time given the estimates are so close to the frequentist versions.
The posteriors and trace plots look similar, with the intercept just looking a little choppy.
One helpful type of plot is superimposing the prior with the probability of direction, to look at the consistency between the choice of prior and the posterior. If there is a mismatch, it does not automatically mean there is a problem, but it at least prompts you to reflect and ask questions of your model choices.
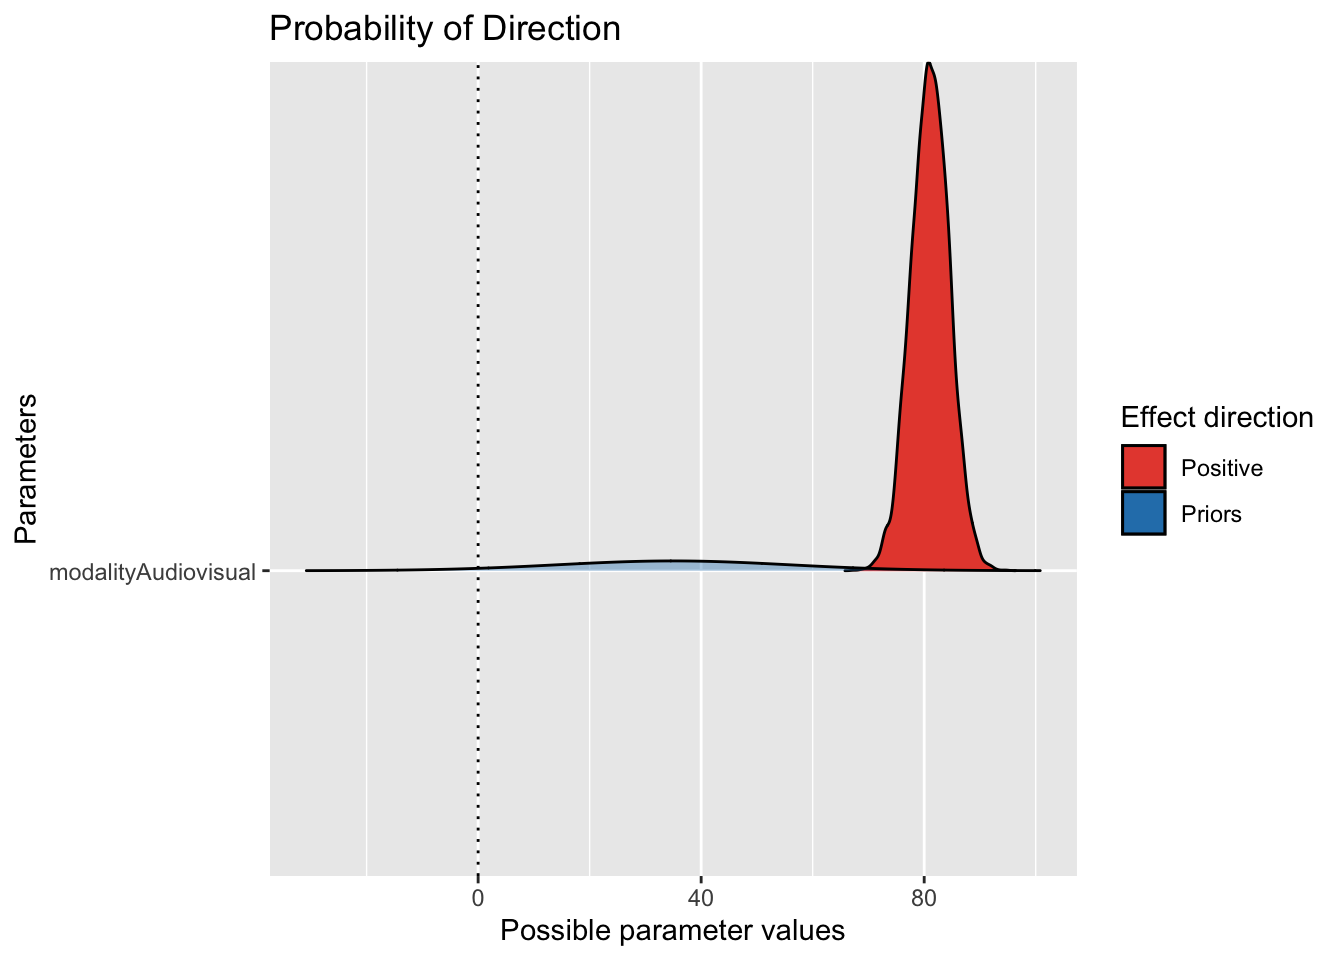
Here, we can see the slope estimate is firmly positive with quite a narrow posterior compared to the prior we set. We allowed a wide range given the previous study, so the data have been the dominant force here.
If we wanted to plot the model predictions and help communicate our findings, we can take the conditional effects plot and tidy things up a little.
conditional_plot <- conditional_effects(brown_informed_priors)

plot(conditional_plot,
     plot = FALSE)[[1]] + #I don't know why you need this, but it doesn't work without
  theme_classic() +
  scale_y_continuous(limits = c(900, 1200),
                     breaks = seq(900, 1200, 50)) +
  labs(x = "Modality",
       y = "Response Time (ms)")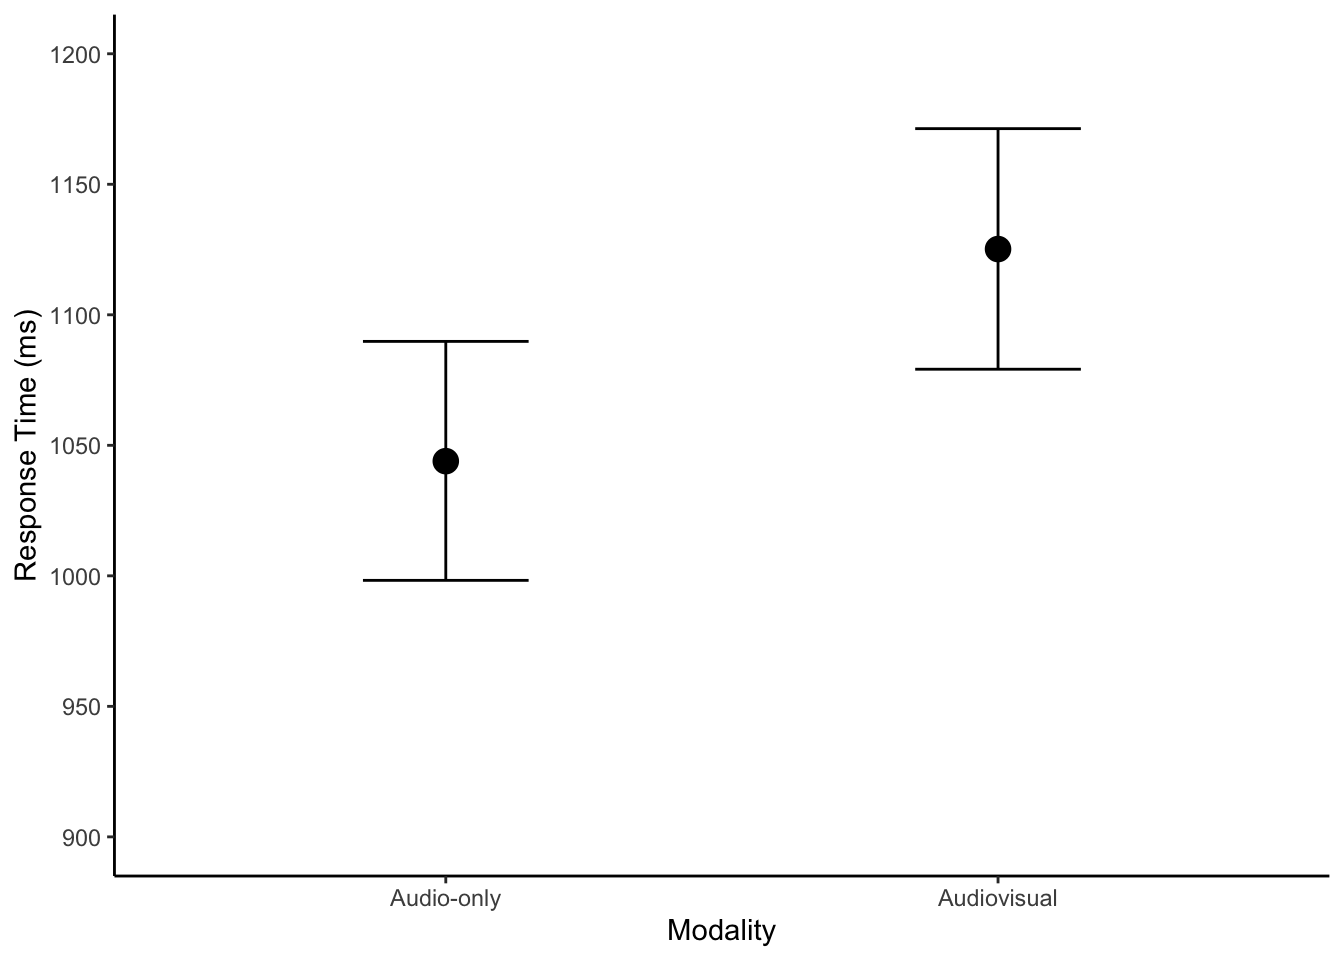
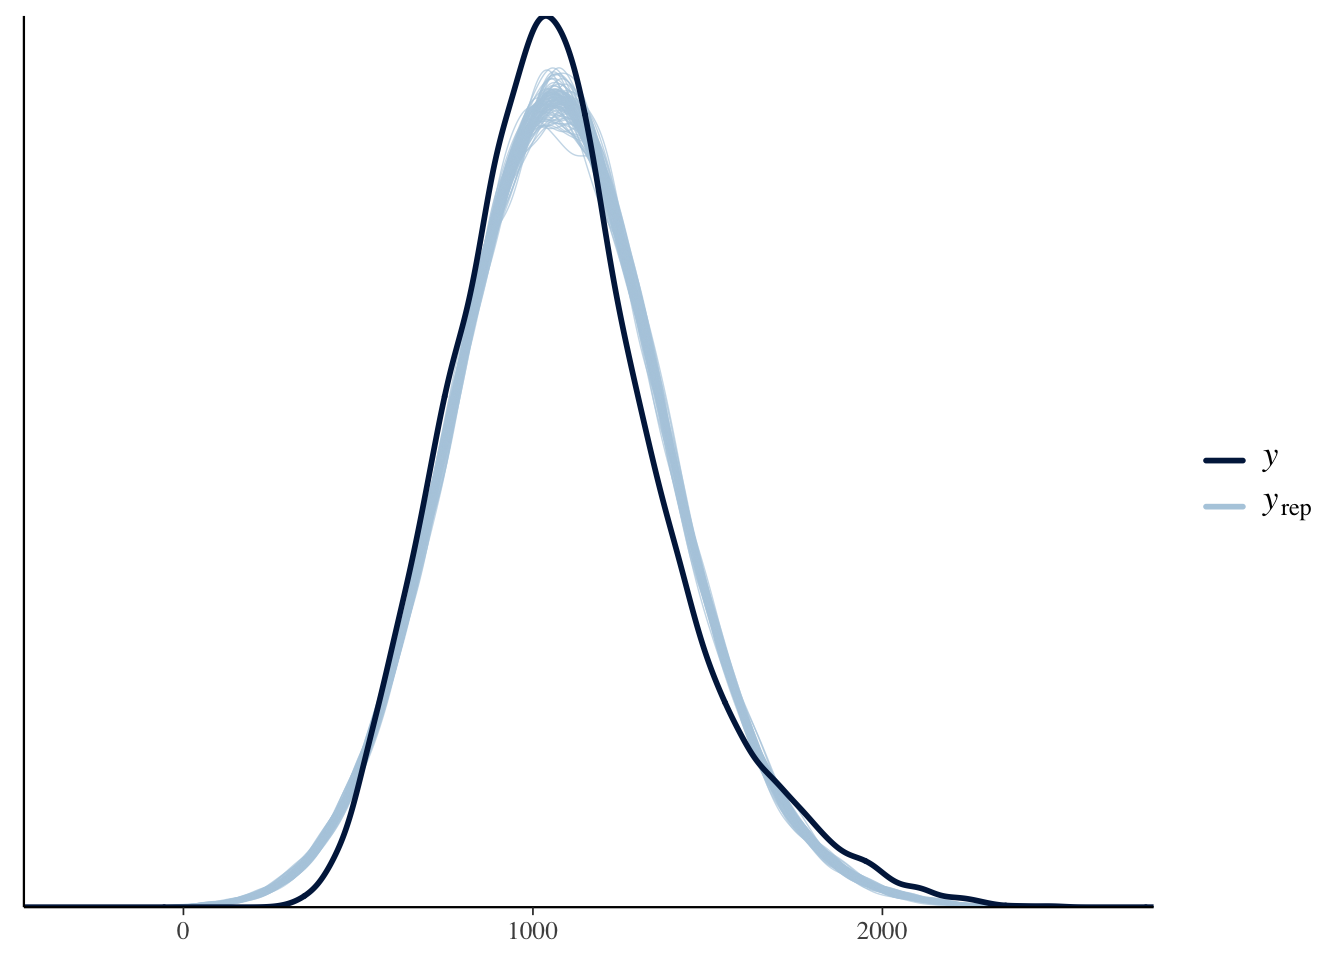
There is not anything different to the descriptive model, but we can run the posterior predictive check just to follow the process.