2 Zero Hunger
![]()
End hunger, achieve food security and improved nutrition and promote sustainable agriculture
Source: The Global Hunger Index
Each country’s GHI score is calculated based on a formula that combines four indicators that together capture the multidimensional nature of hunger:
- Undernourishment: the share of the population whose caloric intake is insufficient;
- Child stunting: the share of children under the age of five who have low height for their age, reflecting chronic undernutrition;
- Child wasting: the share of children under the age of five who have low weight for their height, reflecting acute undernutrition; and
- Child mortality: the share of children who die before their fifth birthday, reflecting in part the fatal mix of inadequate nutrition and unhealthy environments.
Read more about the methods and measures.
2.1 Simplified Subsets
2.1.1 Clean Data
This dataset needs to be cleaned a bit before you can use it. This can be a good exercise for students, or you can use the pre-cleaned version below.
Some of the things to fix are:
- the desired data is on the third sheet
- the original column names are not ideal
- the spreadsheet has notes below the data
- uses “—” to represent missing values
- contains text cells in numeric columns like “<5”
- some numeric values import like “35.700000000000003”
- the country names are unlikely to match other data
Here, we choose to use the value of 5 for all cells with “<5”, but you might choose another solution.
Data Cleaning Code
One thing generative AI is pretty good at is helping with tedious rote tasks. We need to get the 3-letter country code for all of the countries. We can use the code below to get a quoted and comma-separated list of the country names, and ask genAI:
Give me the 3-letter ISO country code for each country in this list. Return the data in R vector format, like c(‘AFG’, ALB’, …)
'Afghanistan', 'Albania', 'Algeria', 'Angola', 'Argentina', 'Armenia', 'Azerbaijan', 'Bahrain', 'Bangladesh', 'Belarus', 'Benin', 'Bhutan', 'Bolivia (Plurinat. State of)', 'Bosnia & Herzegovina', 'Botswana', 'Brazil', 'Bulgaria', 'Burkina Faso', 'Burundi', 'Cabo Verde', 'Cambodia', 'Cameroon', 'Central African Republic', 'Chad', 'Chile', 'China', 'Colombia', 'Comoros', 'Congo (Republic of)', 'Costa Rica', 'Côte d'Ivoire', 'Croatia', 'Dem. Rep. of the Congo', 'Djibouti', 'Dominican Republic', 'Ecuador', 'Egypt', 'El Salvador', 'Equatorial Guinea', 'Eritrea', 'Estonia', 'Eswatini', 'Ethiopia', 'Fiji', 'Gabon', 'Gambia', 'Georgia', 'Ghana', 'Guatemala', 'Guinea', 'Guinea-Bissau', 'Guyana', 'Haiti', 'Honduras', 'Hungary', 'India', 'Indonesia', 'Iran (Islamic Republic of)', 'Iraq', 'Jamaica', 'Jordan', 'Kazakhstan', 'Kenya', 'Korea (DPR)', 'Kuwait', 'Kyrgyzstan', 'Lao PDR', 'Latvia', 'Lebanon', 'Lesotho', 'Liberia', 'Libya', 'Lithuania', 'Madagascar', 'Malawi', 'Malaysia', 'Maldives', 'Mali', 'Mauritania', 'Mauritius', 'Mexico', 'Moldova (Rep. of)', 'Mongolia', 'Montenegro', 'Morocco', 'Mozambique', 'Myanmar', 'Namibia', 'Nepal', 'Nicaragua', 'Niger', 'Nigeria', 'North Macedonia', 'Oman', 'Pakistan', 'Panama', 'Papua New Guinea', 'Paraguay', 'Peru', 'Philippines', 'Qatar', 'Romania', 'Russian Federation', 'Rwanda', 'Saudi Arabia', 'Senegal', 'Serbia', 'Sierra Leone', 'Slovakia', 'Solomon Islands', 'Somalia', 'South Africa', 'South Sudan', 'Sri Lanka', 'Sudan', 'Suriname', 'Syrian Arab Republic', 'Tajikistan', 'Tanzania (United Rep. of)', 'Thailand', 'Timor-Leste', 'Togo', 'Trinidad & Tobago', 'Tunisia', 'Türkiye', 'Turkmenistan', 'Uganda', 'Ukraine', 'United Arab Emirates', 'Uruguay', 'Uzbekistan', 'Venezuela (Boliv. Rep. of)', 'Viet Nam', 'Yemen', 'Zambia', 'Zimbabwe'ChatGPT returned the following, which I added as a new column to the data:
Add Country Codes
ghi_2024$country_code <- c(
  'AFG', 'ALB', 'DZA', 'AGO', 'ARG', 'ARM', 'AZE', 'BHR', 'BGD', 'BLR', 'BEN', 'BTN',
  'BOL', 'BIH', 'BWA', 'BRA', 'BGR', 'BFA', 'BDI', 'CPV', 'KHM', 'CMR', 'CAF', 'TCD',
  'CHL', 'CHN', 'COL', 'COM', 'COG', 'CRI', 'CIV', 'HRV', 'COD', 'DJI', 'DOM', 'ECU',
  'EGY', 'SLV', 'GNQ', 'ERI', 'EST', 'SWZ', 'ETH', 'FJI', 'GAB', 'GMB', 'GEO', 'GHA',
  'GTM', 'GIN', 'GNB', 'GUY', 'HTI', 'HND', 'HUN', 'IND', 'IDN', 'IRN', 'IRQ', 'JAM',
  'JOR', 'KAZ', 'KEN', 'PRK', 'KWT', 'KGZ', 'LAO', 'LVA', 'LBN', 'LSO', 'LBR', 'LBY',
  'LTU', 'MDG', 'MWI', 'MYS', 'MDV', 'MLI', 'MRT', 'MUS', 'MEX', 'MDA', 'MNG', 'MNE',
  'MAR', 'MOZ', 'MMR', 'NAM', 'NPL', 'NIC', 'NER', 'NGA', 'MKD', 'OMN', 'PAK', 'PAN',
  'PNG', 'PRY', 'PER', 'PHL', 'QAT', 'ROU', 'RUS', 'RWA', 'SAU', 'SEN', 'SRB', 'SLE',
  'SVK', 'SLB', 'SOM', 'ZAF', 'SSD', 'LKA', 'SDN', 'SUR', 'SYR', 'TJK', 'TZA', 'THA',
  'TLS', 'TGO', 'TTO', 'TUN', 'TUR', 'TKM', 'UGA', 'UKR', 'ARE', 'URY', 'UZB', 'VEN',
  'VNM', 'YEM', 'ZMB', 'ZWE'
)
Since I never blindly trust genAI, I’m going to sense check this against the country codes from a trusted source, and visually inspect all of the instances where the country in ghi_2024 doesn’t match the country name.
Check Country Codes
| country | country_code | name |
|---|---|---|
| Bolivia (Plurinat. State of) | BOL | Bolivia, Plurinational State of |
| Bosnia & Herzegovina | BIH | Bosnia and Herzegovina |
| Congo (Republic of) | COG | Congo |
| Dem. Rep. of the Congo | COD | Congo, Democratic Republic of the |
| Iran (Islamic Republic of) | IRN | Iran, Islamic Republic of |
| Korea (DPR) | PRK | Korea, Democratic People’s Republic of |
| Lao PDR | LAO | Lao People’s Democratic Republic |
| Moldova (Rep. of) | MDA | Moldova, Republic of |
| Tanzania (United Rep. of) | TZA | Tanzania, United Republic of |
| Trinidad & Tobago | TTO | Trinidad and Tobago |
| Venezuela (Boliv. Rep. of) | VEN | Venezuela, Bolivarian Republic of |
You can see that they’re all just alternative ways of writing the country name.
This data set is good for practicing data reshaping from wide to long. You can also join it with data from other sets that have 3-letter ISO country codes.
| country | 2000 | 2008 | 2016 | 2024 | country_code |
|---|---|---|---|---|---|
| Afghanistan | 49.6 | 35.7 | 27.1 | 30.8 | AFG |
| Albania | 16.0 | 15.5 | 6.2 | 7.9 | ALB |
| Algeria | 14.5 | 11.0 | 8.5 | 6.7 | DZA |
| Angola | 63.8 | 42.7 | 25.9 | 26.6 | AGO |
| Argentina | 6.6 | 5.4 | 5.2 | 6.6 | ARG |
| Armenia | 19.2 | 11.7 | 6.4 | 5.1 | ARM |
2.1.2 Long format
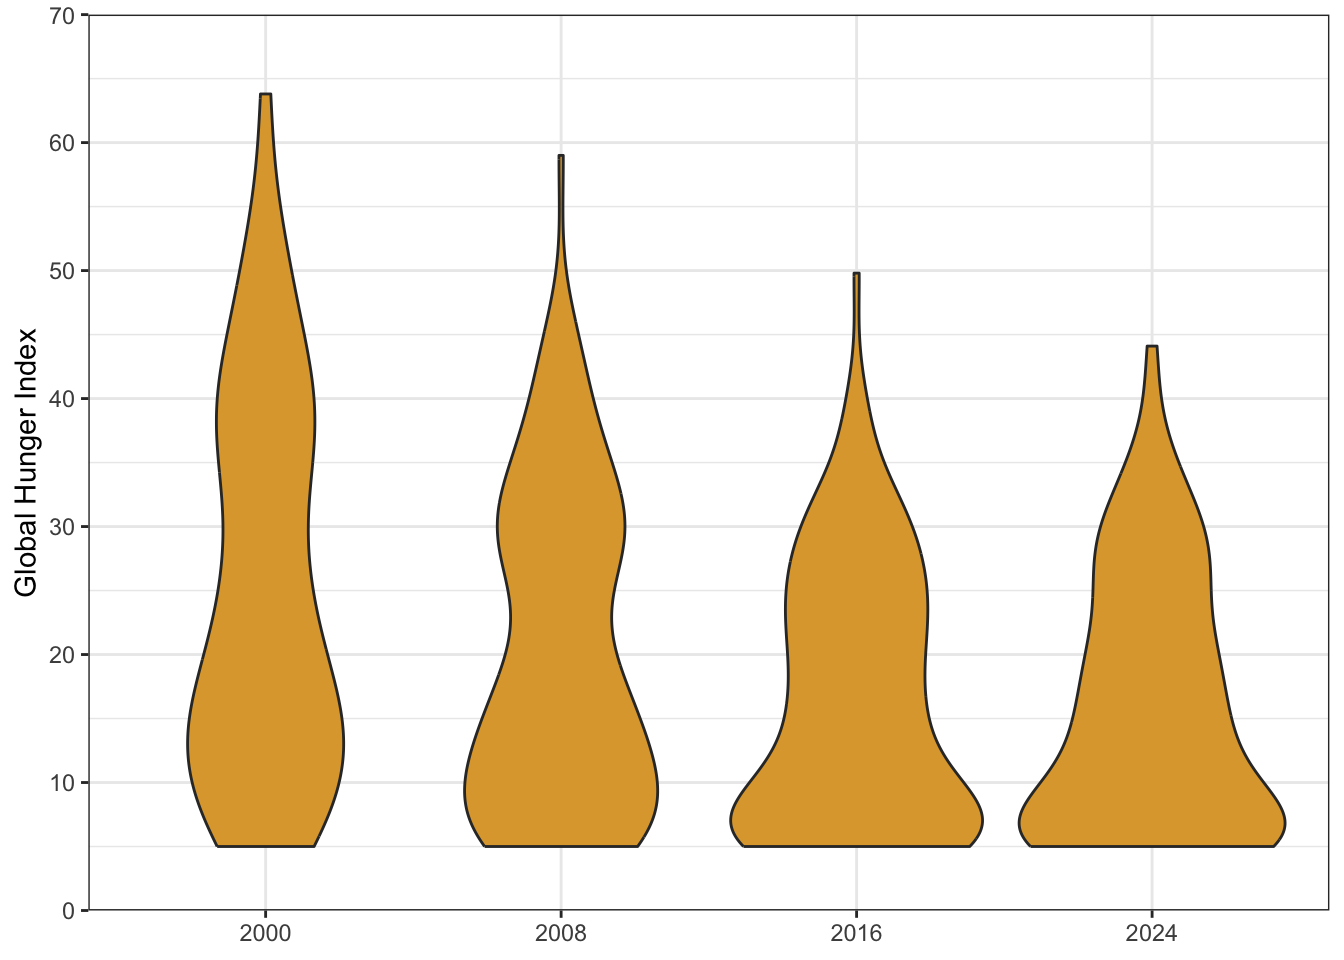
The original data is in wide format, with one column per year. We can also provide the data in long format. It is almost always better to have data in long format for things like wrangling and plotting.
| country | country_code | year | ghi |
|---|---|---|---|
| Afghanistan | AFG | 2000 | 49.6 |
| Afghanistan | AFG | 2008 | 35.7 |
| Afghanistan | AFG | 2016 | 27.1 |
| Afghanistan | AFG | 2024 | 30.8 |
| Albania | ALB | 2000 | 16.0 |
| Albania | ALB | 2008 | 15.5 |
Plot Code
2.1.3 Indicators
The second sheet of the excel file contains indicators used to calculate the GHI. This also needs a fair bit of cleaning.
Code
cn <- c("country",
"undernourishment_2000",
"undernourishment_2008",
"undernourishment_2016",
"undernourishment_2024",
"wasting_2000", NA,
"wasting_2008", NA,
"wasting_2016", NA,
"wasting_2024", NA,
"stunting_2000", NA,
"stunting_2008", NA,
"stunting_2016", NA,
"stunting_2024", NA,
"mortality_2000",
"mortality_2008",
"mortality_2016",
"mortality_2024")
ct <- c("text",
rep("text", 4),
rep(c("text", "skip"), 8),
rep("text", 4))
ghi_indicators <- readxl::read_xlsx(
"data/02/ghi-2024.xlsx",
sheet = 2, range = "B4:Z139", na = "—",
col_names = cn, col_types = ct) |>
pivot_longer(-country) |>
separate(name, c("indicator", "year")) |>
mutate(value = ifelse(value == "< 2.5", 2.5, value),
value = as.numeric(value) |> round(1)) |>
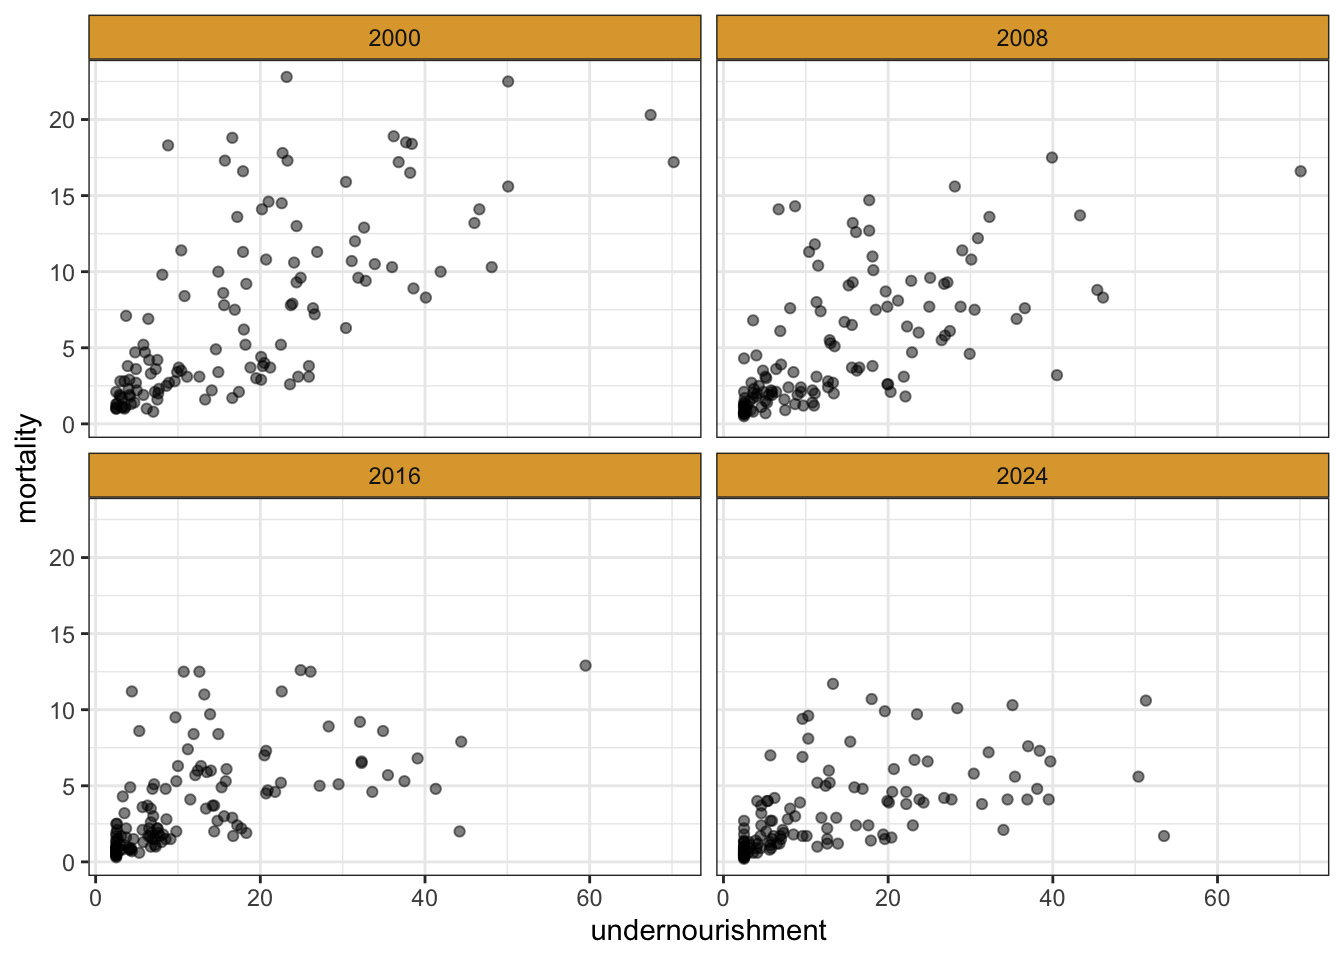
pivot_wider(names_from = indicator)This data set is in intermediate format (long for years and wide for measures) and is good for teaching about data reshaping and multivariate correlations.
| country | year | undernourishment | wasting | stunting | mortality |
|---|---|---|---|---|---|
| Afghanistan | 2000 | 46.0 | 8.9 | 54.4 | 13.2 |
| Afghanistan | 2008 | 25.1 | 7.2 | 50.8 | 9.6 |
| Afghanistan | 2016 | 20.5 | 5.1 | 38.2 | 7.0 |
| Afghanistan | 2024 | 30.4 | 3.6 | 44.6 | 5.8 |
| Albania | 2000 | 4.9 | 6.5 | 32.8 | 2.7 |
| Albania | 2008 | 7.4 | 9.6 | 23.2 | 1.6 |