4 Quality Education
![]()
Ensure inclusive and equitable quality education and promote lifelong learning opportunities for all
4.1 Original Data
Indicator 4.3.1, Participation rate of youth and adults in formal and non-formal education and training in the previous 12 months, by sex.
| indicatorId | geoUnit | year | value | qualifier | magnitude |
|---|---|---|---|---|---|
| PRYA.12MO.AG15T24.F | AFG | 2014 | 20.67723 | UIS_EST | NA |
| PRYA.12MO.AG15T24.F | AFG | 2017 | 18.43835 | UIS_EST | NA |
| PRYA.12MO.AG15T24.F | AFG | 2020 | 12.90209 | UIS_EST | NA |
| PRYA.12MO.AG15T24.F | AFG | 2021 | 18.88796 | UIS_EST | NA |
| PRYA.12MO.AG15T24.F | AGO | 2004 | 46.00000 | UIS_EST | NA |
| PRYA.12MO.AG15T24.F | AGO | 2009 | 40.10000 | UIS_EST | NA |
| indicatorId | name | theme | lastDataUpdate | lastDataUpdateDescription | dataAvailability.totalRecordCount | dataAvailability.timeLine.min | dataAvailability.timeLine.max | dataAvailability.geoUnits.types | disaggregations | glossaryTerms |
|---|---|---|---|---|---|---|---|---|---|---|
| PRYA.12MO.AG15T24.F | Participation rate of youth and adults in formal and non-formal education and training in the previous 12 months, 15-24 years old, female (%) | EDUCATION | 2025-02-23 | February 2025 Data Release | 2951 | 1976 | 2024 | REGIONAL, NATIONAL | Sex:Female, AgeRange:15-24 | 3068 |
4.2 Simplified Subsets
4.2.1 Joined Data for Countries
The UNESCO data comes in a particular format that requires some joining to make sense of it. The values are all “Participation rate of youth and adults in formal and non-formal education and training in the previous 12 months”, disaggregated by sex and age range.
The data include both countries and aggregated regions, so we will filter this set to just individual countries with 3-letter geoUnits.
Code
sex_levels <- c("Sex:Female", "Sex:Male")
sex_labels <- c("female", "male")
age_levels <- c("AgeRange:15-24", "AgeRange:25-54", "AgeRange:55-64")
age_labels <- c("15-24", "25-54", "55-64")

edu_country <- left_join(edu_data, edu_indicators, by = "indicatorId") |>
  filter(nchar(geoUnit) == 3) |>
  select(
    country_code = geoUnit,
    year,
    rate = value,
    disaggregations
  ) |>
  separate(disaggregations, c("sex", "age_range"), sep = ", ") |>
  mutate(sex = factor(sex, sex_levels, sex_labels),
age_range = factor(age_range, age_levels, age_labels))| country_code | year | rate | sex | age_range |
|---|---|---|---|---|
| AFG | 2014 | 20.67723 | female | 15-24 |
| AFG | 2017 | 18.43835 | female | 15-24 |
| AFG | 2020 | 12.90209 | female | 15-24 |
| AFG | 2021 | 18.88796 | female | 15-24 |
| AGO | 2004 | 46.00000 | female | 15-24 |
| AGO | 2009 | 40.10000 | female | 15-24 |
Plot Code
edu_country |>
  summarise(rate = mean(rate, na.rm = TRUE), .by = c(country_code, age_range, year)) |>
  filter(age_range == "15-24") |>
  ggplot(aes(x = year, y = fct_rev(country_code), fill = rate)) +
  geom_tile() +
  scale_fill_viridis_c(limits = c(0, 100)) +
  guides(fill = guide_colorbar(position = "inside")) +
  labs(x = NULL, y = NULL, fill = NULL) +
  theme(legend.position.inside = c(.07, .96))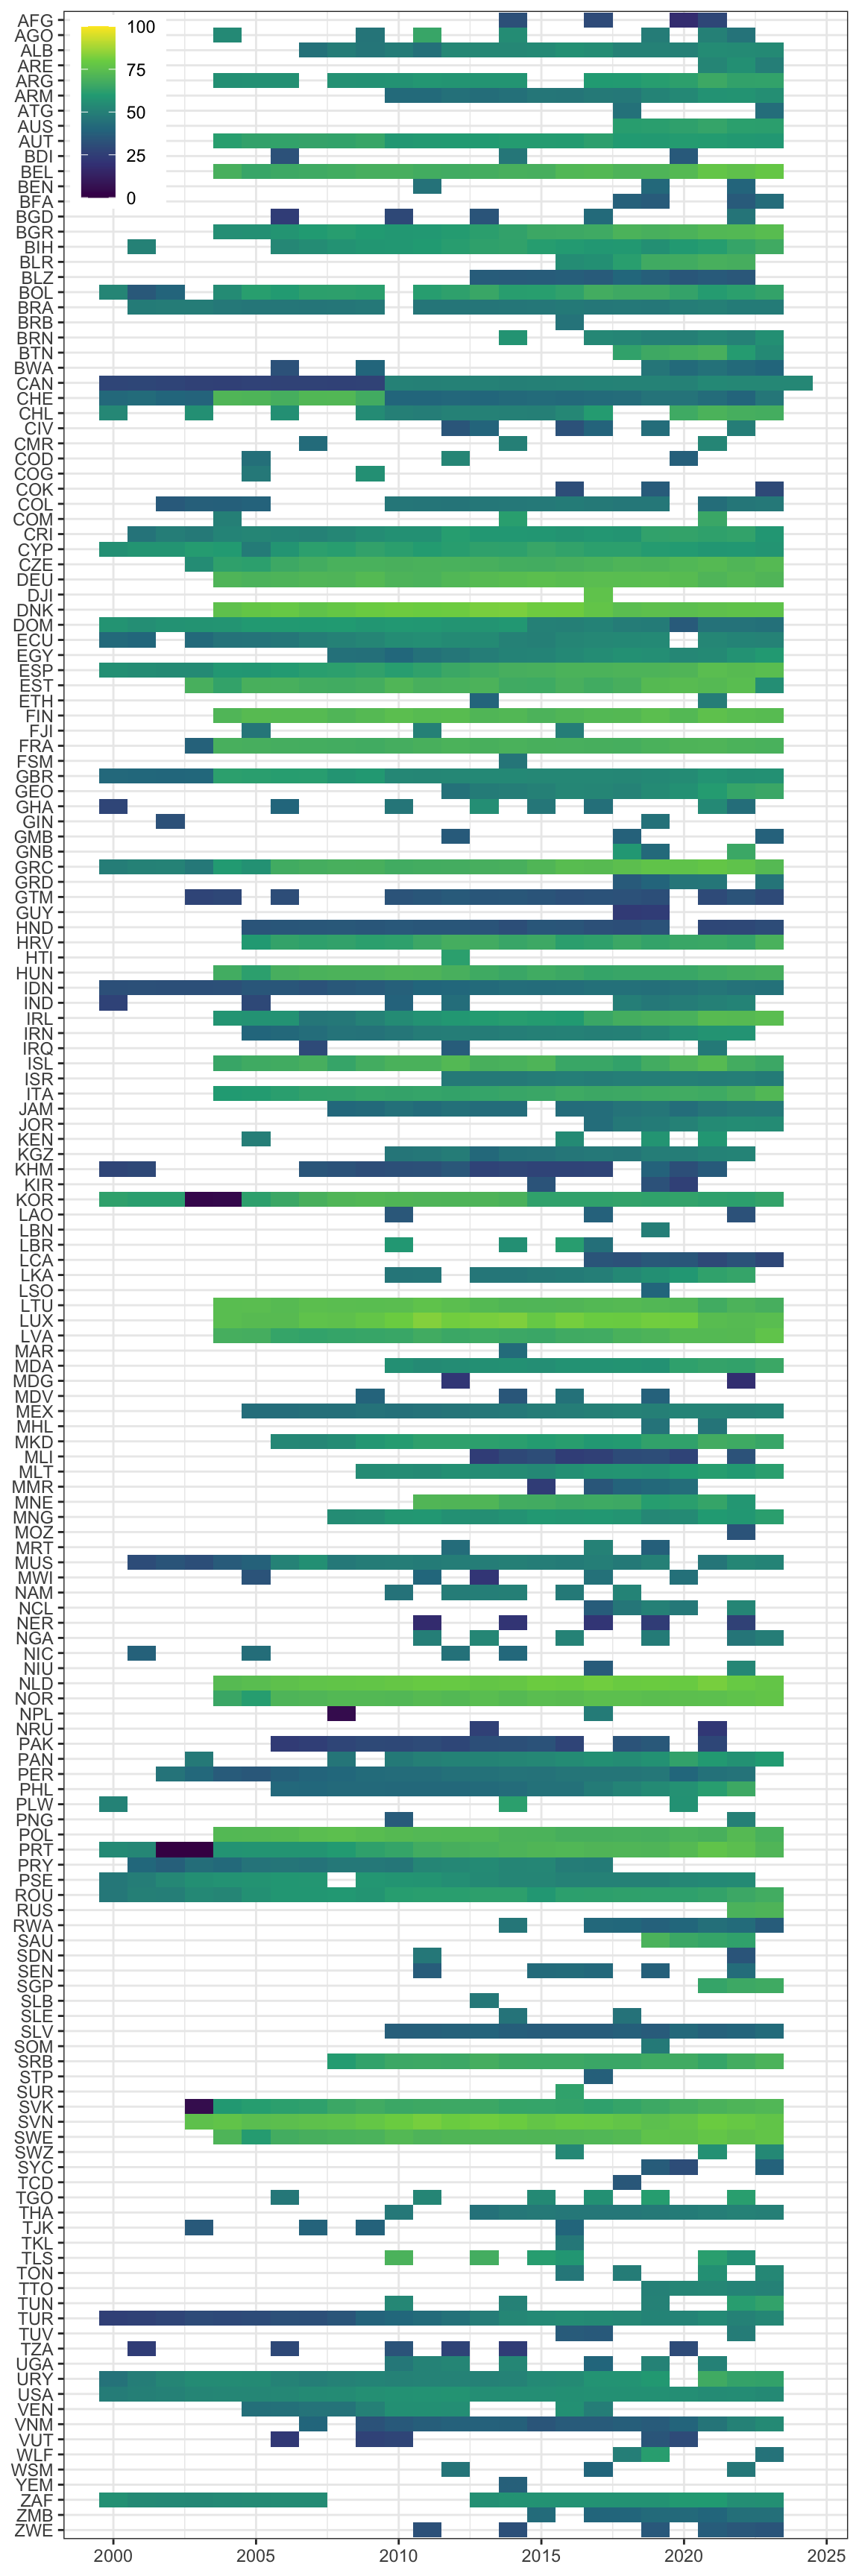
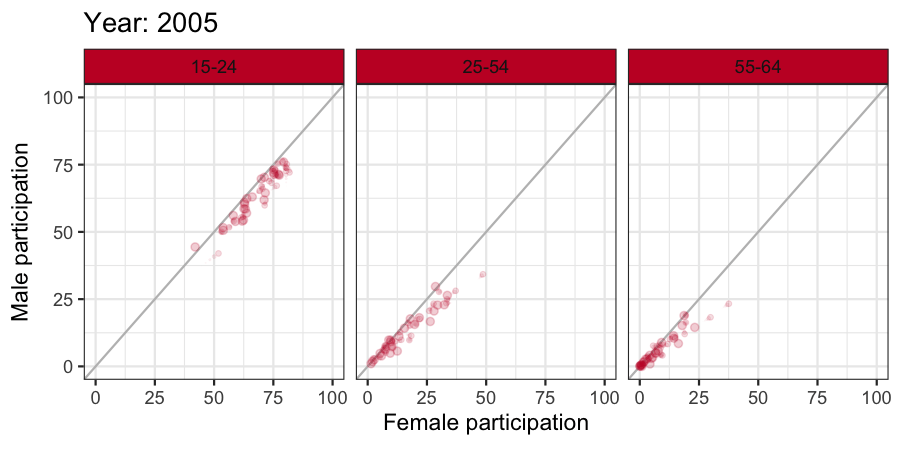
4.2.2 Complete Data
There is a lot of missing data in the set above. This set is limited to countries that have data for every year between 2005 and 2024.
| country_code | year | rate | sex | age_range |
|---|---|---|---|---|
| AUT | 2005 | 63.80000 | female | 15-24 |
| AUT | 2006 | 64.10000 | female | 15-24 |
| AUT | 2007 | 64.40000 | female | 15-24 |
| AUT | 2008 | 65.00000 | female | 15-24 |
| AUT | 2009 | 64.70000 | female | 15-24 |
| AUT | 2010 | 61.29137 | female | 15-24 |
Plot Code
anim <- edu_complete |>
  pivot_wider(names_from = sex, values_from = rate) |>
  ggplot(aes(x = female, y = male)) +
  geom_abline(slope = 1, intercept = 0, color = "grey") +
  geom_point(color = "#C5192D", alpha = 0.2) +
  facet_wrap(~age_range) +
  coord_cartesian(xlim = c(0, 100), ylim = c(0, 100)) +
  labs(x = "Female participation", y = "Male participation",
       title = "Year: {floor(frame_time)}") +
  theme(strip.background = element_rect(fill = "#C5192D")) +
  transition_time(year) +
  shadow_wake(wake_length = 0.1)

anim_save("images/edu_complete.gif",
          animation = anim,
          nframes = 100, fps = 12,
          start_pause = 5, end_pause = 5,
          width = 6, height = 3,
          units = "in", res = 150,
          renderer = gifski_renderer())