5 Gender Equality
![]()
Achieve gender equality and empower all women and girls
5.1 Original Data
IPU Parline holds longitudinal data on national parliaments. We accessed data on the percentage of women in the upper house from 1945 to 2025, in 5-year increments. Each year has to be downloaded as a separate file, so we provide a zip file of them below.
5.2 Simplified Subsets
5.2.1 Import Multiple Files
These files are a little tricky to import. You have to download a separate file for each year, and they all start with 15 rows of metadata.
The code below imports all of the files, fixes some column type problems (e.g., Status is NA for most files, but “Suspended” on 9 occasions, so you need to specify it should be a text column for all files). The Year column is blank for all entries, so I’ve skipped it and reconstructed the year from the filename ID. Finally, I used the {janitor} package to clean up the names.
Code
na_values <- c("-", "",
               "No information available",
               "Not applicable")

parliament <- list.files("data/05/ipu", "\\.csv", full.names = TRUE) |>
  read_csv(id = "filename",
           skip = 15,
           na = na_values,
           col_types = "ccccn-DDccc") |>
  # get year from filename
  separate(filename, c(NA, NA, "year", NA, NA, NA),
           sep = "--", convert = TRUE) |>
janitor::clean_names()| year | iso_code | country | chamber | status | percentage_of_women | date_from | date_to | notes | structure | chamber_type |
|---|---|---|---|---|---|---|---|---|---|---|
| 1945 | AF | Afghanistan | House of Elders | NA | NA | NA | NA | NA | Bicameral | Upper chamber |
| 1945 | DZ | Algeria | Council of the Nation | NA | NA | NA | NA | NA | Bicameral | Upper chamber |
| 1945 | AG | Antigua and Barbuda | Senate | NA | NA | NA | NA | NA | Bicameral | Upper chamber |
| 1945 | AR | Argentina | Senate | NA | NA | NA | NA | NA | Bicameral | Upper chamber |
| 1945 | AU | Australia | Senate | NA | 2.8 | 1945-01-01 | 1945-12-31 | NA | Bicameral | Upper chamber |
| 1945 | AT | Austria | Federal Council | NA | 0.0 | 1945-01-01 | 1948-12-31 | NA | Bicameral | Upper chamber |
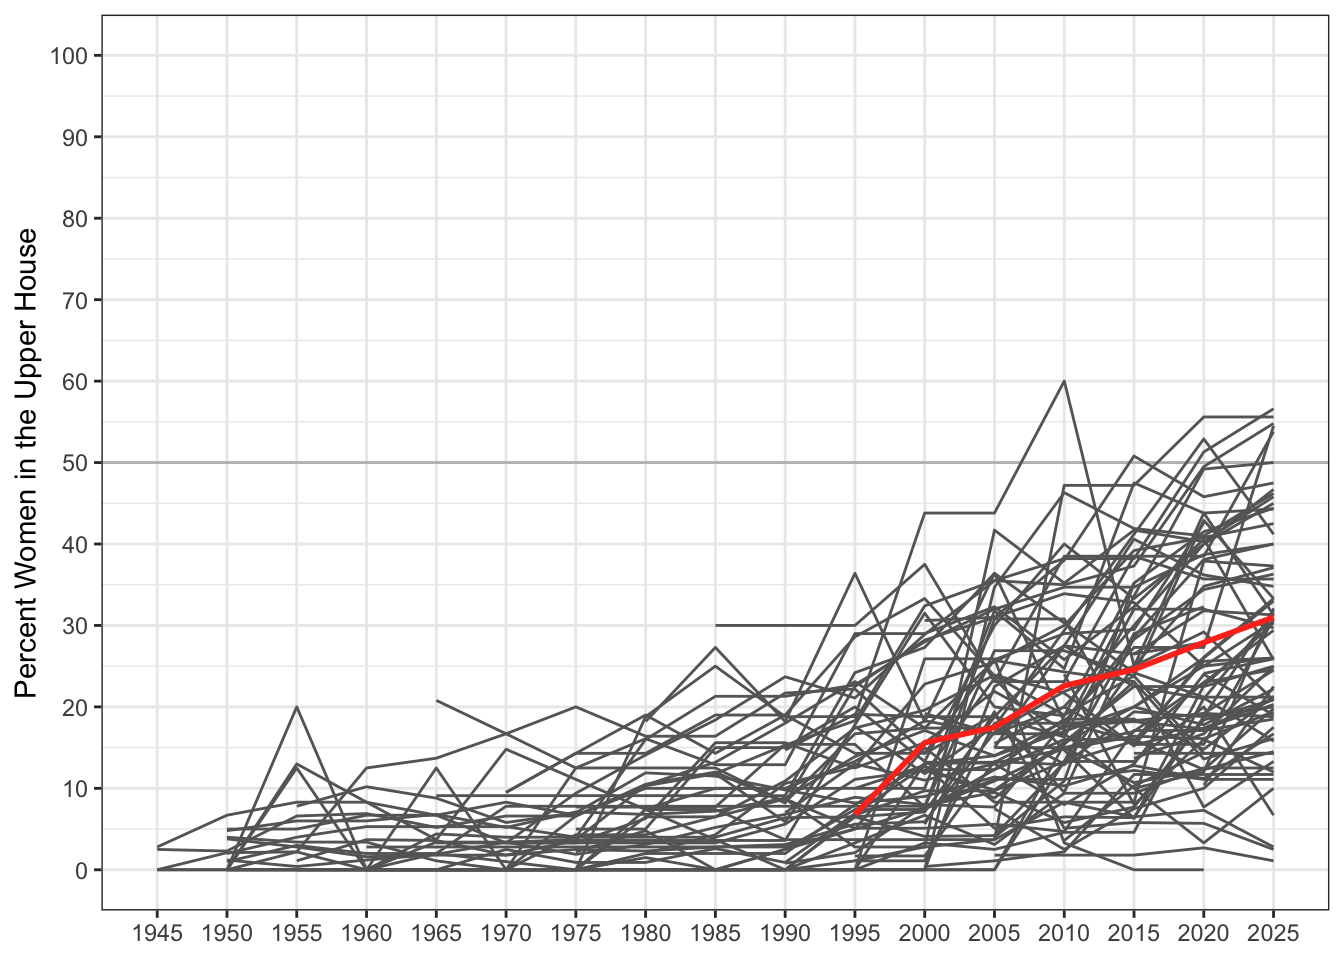
Plot Code
uk <- filter(parliament, iso_code == "GB")

ggplot(parliament, aes(x = year, y = percentage_of_women, group = iso_code)) +
  geom_hline(yintercept = 50, color = "grey") +
  geom_line(show.legend = FALSE, color = "grey40", na.rm = TRUE) +
  geom_line(data = uk, linewidth = 1, color = "#FF3A21", na.rm = TRUE) +
  coord_cartesian(ylim = c(0,100)) +
  scale_x_continuous(breaks = seq(1945, 2025, 5), minor_breaks = NULL) +
  scale_y_continuous(breaks = seq(0, 100, 10)) +
  labs(x = NULL, y = "Percent Women in the Upper House")
5.2.2 Simplified
The dataset has some columns we don’t really need, and uses 2-character ISO country codes, so we’ll simplify it by including only the most relevant columns, adding 3-letter codes, and removing rows with no data.
| structure | chamber_type | n |
|---|---|---|
| Bicameral | Upper chamber | 1351 |
| Unicameral | NA | 103 |
| NA | Upper chamber | 8 |
| country_name | country_code | year | pcnt_women |
|---|---|---|---|
| Australia | AUS | 1945 | 2.8 |
| Austria | AUT | 1945 | 0.0 |
| Brazil | BRA | 1945 | 0.0 |
| Canada | CAN | 1945 | 2.5 |
| Chile | CHL | 1945 | 0.0 |
| Argentina | ARG | 1950 | 0.0 |
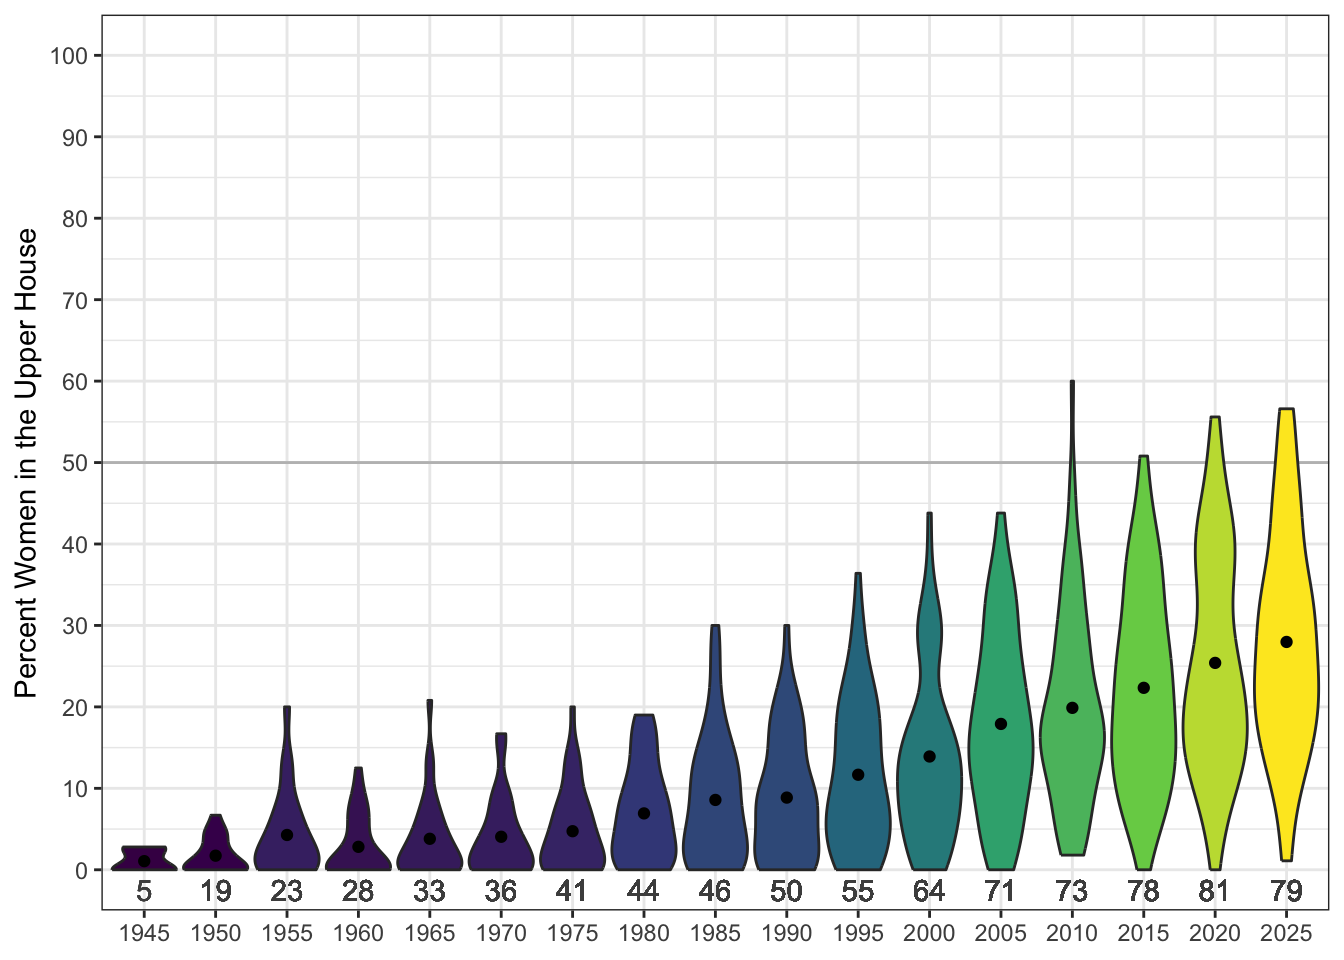
Plot Code
parliament_simple |>
  mutate(mean = mean(pcnt_women),
         n_countries = n(),
         .by = year) |>
  ggplot(aes(x = factor(year), y = pcnt_women, fill = mean)) +
  geom_hline(yintercept = 50, color = "grey") +
  geom_violin(scale = "width") +
  geom_text(aes(label = n_countries), y = -2.5, color = "grey30") +
  stat_summary(fun.data = mean_se, geom = "point") +
  coord_cartesian(ylim = c(0,100)) +
  scale_y_continuous(breaks = seq(0, 100, 10)) +
  labs(x = NULL, y = "Percent Women in the Upper House") +
  scale_fill_viridis_c(guide = NULL)
5.3 Resources
- [IPU](https://data.ipu.org/