10 Next Steps
Intended Learning Outcomes
This book and class are only intended to get you started with the skills you will need to begin your journey into reproducible research. There are many other things you can do with R and quarto, some of which are listed below.
10.1 Plots
Appendix M will introduce you to some more plot styles, like maps and word clouds, and things you can do with plots, such as add annotations.
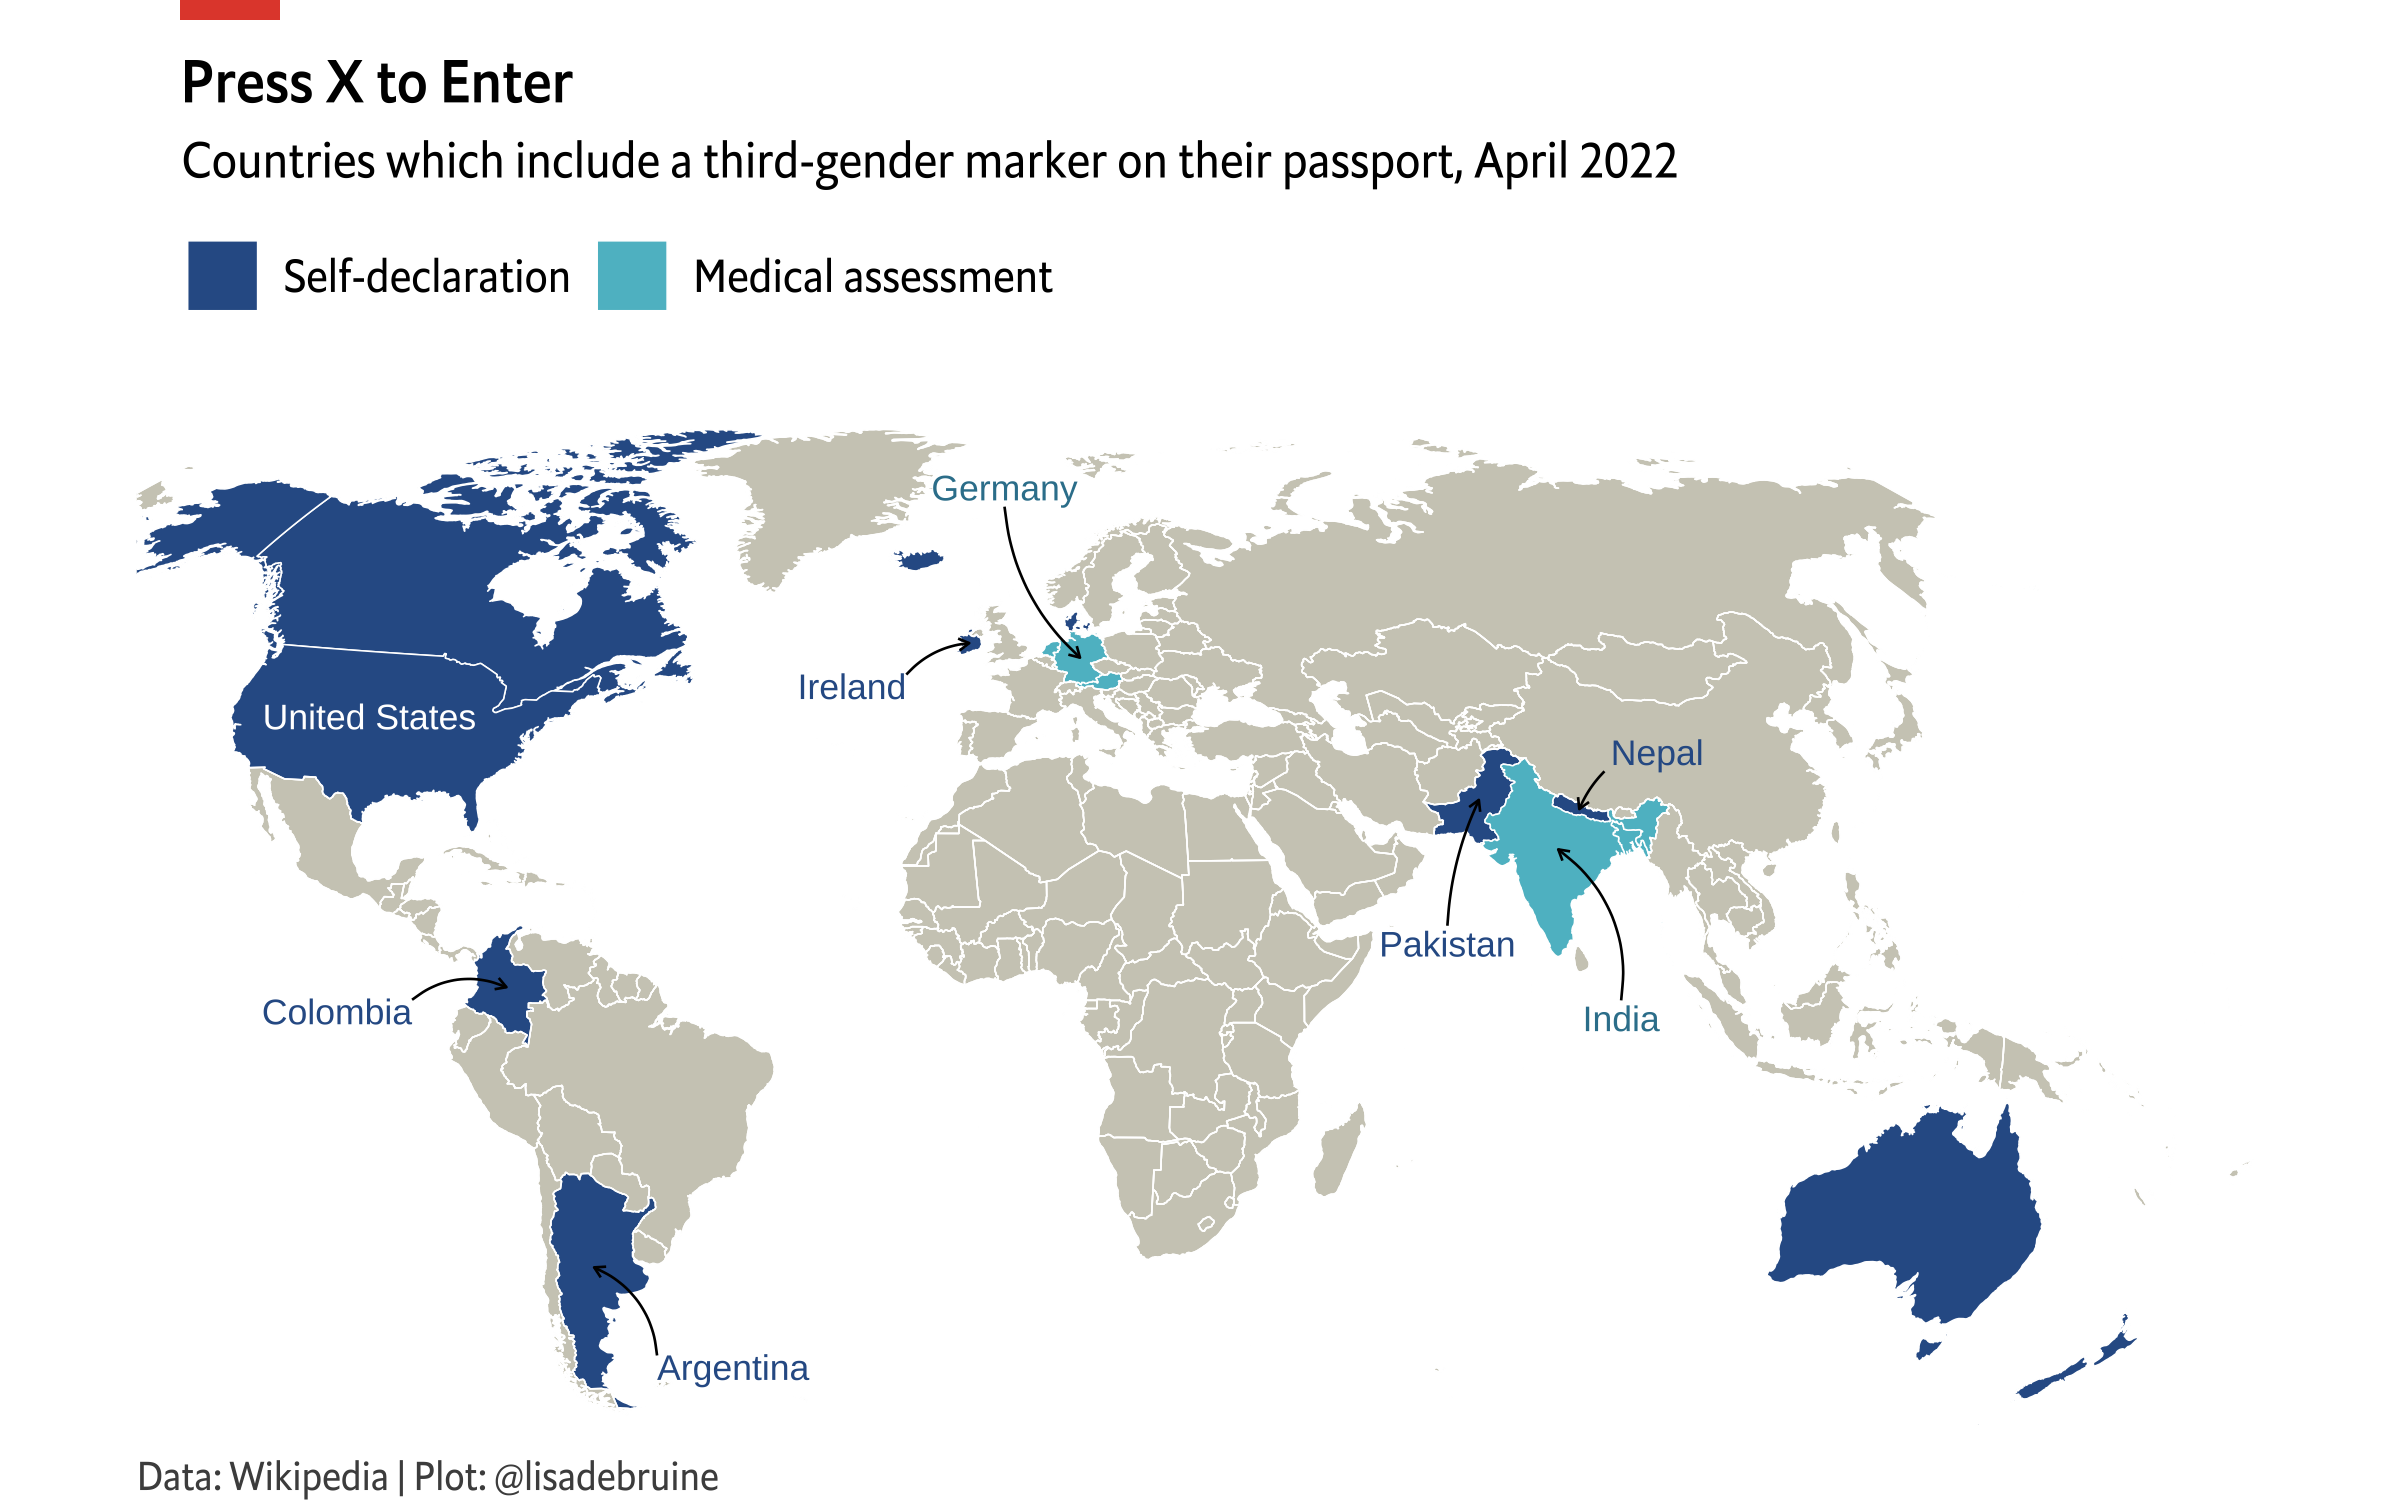
Lisa participated in the 2022 30 Day Chart Challenge and ended up collecting all 30 plots in a tutorial book with step-by-step explanations of how they created them.
10.2 Websites and Other Outputs
We’ve been concentrating on creating single documents with quarto, but you can do much more with it, such as create presentations and websites. See the quarto guide for a list of everything that it can do.
Appendix N will teach you how to create a simple webpage using quarto, link multiple pages, and style your content using css.
You can easily create presentations using revealjs in quarto. Get started by creating a new quarto document, pasting in the following, and rendering it.
---
title: "Presentation Title"
author: "Your Name"
format: revealjs
---

## Slide 1 Title

- Bullet Point 1
- Bullet Point 2

## Slide 2 Title

. . .

- Bullet Point 1

. . .

- Bullet Point 2
Check the revealjs quarto docs for many more things you can do with presentations.
10.3 R Packages
Making an R package develops generic coding skills and gives you valuable insight to how R works. The book Creating an R Package covers setting up a package project, creating functions, documenting them with roxygen, creating vignettes, unit testing, package testing, version control with git, and distribution with github.
10.4 Data Simulation
Lisa frequently teaches workshops on data simulation using the
10.4.1 Data Simulation with {faux}
This lesson covers the basics of simulation using {faux}. We will simulate data with factorial designs by specifying the within and between-subjects factor structure, each cell mean and standard deviation, and correlations between cells where appropriate. This can be used to create simulated data sets to be used in preparing the analysis code for pre-registrations or registered reports. We will also create data sets for simulation-based power analyses. Students will need to have very basic knowledge of R and R Markdown, and have installed {faux}, {afex}, {broom} and {tidyverse}.
10.4.2 Data simulation for mixed designs
This lesson covers simulating data for a mixed design, where trials are crossed with subjects. We will learn how to analyse this using {lme4}, with a focus on understanding how the simulation parameters correspond to the output. Finally, we will learn how to use simulation to calculate power. Students will need to have basic knowledge of R and R Markdown, some familiarity with mixed designs (even if they don’t currently analyse them with mixed models) and have installed {faux}, {afex}, {tidyverse}, and {lme4}.
10.5 Quarto and Other Coding Languages
R is not the only coding language you can use with quarto to make your research more reproducible. Quarto supports many coding languages, such as python and julia. If you also use one of these languages, try setting up a quarto document with it.
10.6 Shiny Apps
Shiny lets you make web applications that do anything you can code in R. For example, you can share your data analysis in a dynamic way with people who don’t use R, collect and visualize data, or even make data aRt. Try the Getting Started in Shiny tutorial on Posit.